coverand theirfin.~! ve1s:lor.1of International 1.:1acc,:11aw l\,4althouse Avenue, Cardiff Gate, -·---------------------~-------- Examiner2 A 2 2 B in...
10 downloads
26 Views
1MB Size
cover and their fin.~! ve1s:lor.1of
International 1.:1acc,:11aw l\,4althouse Avenue, Cardiff Gate,
-·---------------------~--------
Examiner2
A
2
2
B introduction
2
2
c
4
4
D
4
4
E reasoned
4
4
F
and evaluation
4
G use
4
4
H conclusion
2
2
4
4
2
,t;.
4
4
J
r>
Name of examiner 2: _ _ __
Examiner
use
B:
A:
/ The Temperature of Cr02 in Relation to its Magnetic Susceptibility
Subject: Physics Word count: 3330
11
Abstract
/
The effect of temperature on the magnetic susceptibility of Cr0 2 was investigated using water to heat the chromium (IV) oxide, which was then brought increasingly closer to neodymium magnets until the force of static friction was overcome and the metal was pulled towards the magnets. The force of static friction needed to pull the Cr0 2 was then calculated, and upon analyzing the videos of the Cr0 2 being attracted to the magnet, the minimum distance required to overcome the force of static friction was calculated. This value was set equal to the force of the magnetic field being exerted on the Cr0 2 at a point, which was used to calculate its magnetic field strength. Using this value, its magnetic susceptibility was calculated and graphed. Upon graphing the relationship between magnetic susceptibility and temperature, it was found that the uncertainties in the experiment were much too large to come to a reasonable conclusion, indicating that there were ....---. many sources or error.
159 words
I
12
Table of Contents
Contents Research Question ..
:f............................................................................................................................... 3
v'
Key Terms .................................................................................................................................................. 3
(
Theory ........................................................................................................................................................... 4 Procedure ...................................................................................................................................................... 6 Data Collection
I Analysis ............................................................................................................................. 7
How data was obtained ............................................................................................................................ 7 Conclusion ................................................................................................................................................... 14 Sources of Error ...................................................................................................................................... 15 Appendix ......
7
..........................................................................................................................................
18 "
( :References ................................................................................................................................................... 20 .;
13
Introduction There have been many physicists such as Neils Bohr and Michael Faraday who have made extremely influential discoveries in the field of electromagnetism. I have chosen to further explore a concept that Madame Curie has discovered, Curie temperature. Since the magnetic susceptibility of a substance can be used as an indicator of Curie point, the relationship between magnetic susceptibility and temperature of Cr02 was explored. This mainly focused on the curie temperature of a fe1To/paramagnetic material, and the effect that temperature has on the ordering of the spins of the electrons in an atom. Since Cr02 is used in cassette tapes, it can be used to determine the ideal temperature at which to imprint tapes; since it needs to be done when it is magnetic properties are extremely minimal so that recording quality can be optimized. Chromium (IV) oxide was chosen as a metal because of its fairly low curie temperature (386 K) 1. In order to investigate this relationship, Cr02 was heated by placing it in a test tube, and heating the test tube with a hot plate while it was in water. This ensured that the plastic from the tape on the Cr0 2 did not melt. The aim of this experiment is to determine a relationship between the magnetic susceptibility of Cr02 and its temperature. This could be applied to the use of cassettes in industry, as it could determine whether or not they are more effective at a certain temperature, since chromium (IV) oxide is used to coat the tapes.
Research Question How does the temperature of chromium (IV) oxide affect its magnetic susceptibility?
Key Terms Magnetic susceptibility: The quantitative measure of the extent to which a material may be magnetized in relation to a given applied magnetic field 2. Curie point/temperature: temperature at which certain magnetic materials undergo a sharp change in their magnetic properties3 • Ferromagnetic: physical phenomenon in which certain electrically uncharged materials strongly attract others4 .
/
1
Guinier & J ullien, pg. 15 5 http://www.britannica.com/EBchecked/topic/3 573 13/magnetic-susceptibility 3 http://www. britann ica.com/EBchecked/topic/ 146902/Curie-po int 4 http://www.britannica.com/EBchecked/topic/205135/ferromagnetism 2
./
14
Theory Chromium (IV) oxide, having 3 unpaired electrons and an electron configuration of [Ar] 3d3 can be classified as ferromagnetic. Under the presence of a magnetic field, the unpaired electrons align, causing the material to exhibit properties of magnetism. If the substance follows the Curie law, then the effective magnetic moment (µeff) can be estimated as: = (1) In this equation, n is the number ofunpaired electrons and µB is a constant known as a Bohr magnetonS, defined as: ~
0.--
7
ei1
µs=~
,/
/
...,.;
/'
Where e is the elementary charge, h is the reduced Planck constant, me is the electron rest M _~ _ mass and c is the speed of light. ~ b s t i t u t i n g n=3 into (l); e..
1 ((:,
~
.,/
(2)
1
1
~ 1 jf.
(3)
'V""'" W\ It ,.,..II\ This value, found in terms of one atom, was then multiplied by the mass of the Cr02, . _,., ~ b measured to be(0.00130±0.0000l)cg, divided by its molar mass, which gives the number of particles 7
VF..
in the sample used. The uncertainty was calculated by dividing the relative uncertainty by the molar mass of Cr02, and then multiplying it for the value of the effective magnetic moment:
µeff
3 597 = · .* lO µeff
9.
~ - .,f...>0 . .!",).
-23
= 5.57
* *
0.00130 ± 0.00001 51.9961 + 15.9999 * 2
c....
10-
Xv= MH;
v
6
'?
(4)
7
()l.""'-
e-
"'1 /
rc)
~
':\
(5) ,'
Where ~ is the magnetic susceptibility, ~is the magnetization, and H is the magnetic field 6 . ~ '~
-
5
.....:..t..
..,,....._ -'-\ ..._
(3) was substituted into (4) to result in the equation:
./
V\
Using the fo'..mu~;
......
~
~
The uncertainty was found to be << 1%, which is negligible.
@>'
"
011.
28
Hoppe Kittel, p. 304
!
IS (6)
-
Since7
~~.,.,. ~#',,., Y vi)
(7)
This leads to a theoretical correlation between magnetic susceptibility (Xv) and the magnetic field (H) a A.A.A.;
..,,,,...
r . //
~~ bl-~~ ...
.~
'!".;/ ~'
5.57• 10- 28
(8)
Xv =--H--
To measure the magnetic field, and thus calculate the magnetic susceptibility, a simplified model will be used, reduced the equation to far fewer variables . ., 1...,/ .Jo • The force of attraction (in newtons) can be expressed by:
~
~,,.,9
6>,
-
,
\yv):
y
max static F .............._
= µ 4rrr m m 1
2
(9)
2
.!'
Whereµ is the permeability of the intervening medium measured in Tesla meter per ampere, mis the magnitude of the magnetic poles measured in Ampere-meter\and r is the distance between t.. /;,.. w. the two magnets in meters 9 . ~ To determine the force at a point, only one m needs to be used, and r becomes the distance :!'( from the magnet. !ll-is also referred to as magnetic field strength, and will be refened to as such, • 1',/" • using the symbol ~ ~ To determme the magnetic force, the other variables need to be known. The distance between / \ c:::; the objects can be measured, the penneability of the intervening medium can be approximated to the magnetic pem1eability of free space, which has a value a@= 4nx 10:::.H·riri:To determine the .}A., force, one can calculate the orce needed to overcome the force of static friction, as that is the point at which the magnetic fore t~s to pull the object. The equation can be written as:
lb
·· ·
l
~ ' \ A A . . ~ --\ tJ"\"""
.,._.. "\ ~ J . •
( ' - .... ' ~--'··...'. C,
F,nax
d
7
)
= µsN
(10)
Where Fmax is the maximum force of static friction, µ 5 is the coefficient of static friction (which is different for every surface), and N is the normal force 10 •
/""'I•,»_.. ,.--
Setting (8) equal to(:,
(
J" ··__.------, ~ :~ ::)
µH .,,......--_...
----µ 4irr 2 sN
./
7
l
·
:c
Levy, pg. 201-202 Guinier & Jullien, pg. 155 9 . / http://geophysics.ou.edu/solid_ earth/notes/mag_basic/mag_basic.htm 1 I 10 Bhavikatti & Rajashekarappa, pg 112 /
8
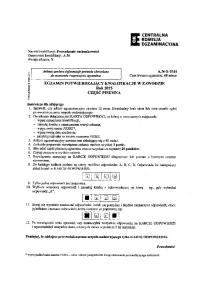
, 16 It is stated that the graphs of magnetic susceptibility, X, and temperature, K, can be shown to
have the correlation as follows 1{
7 .... "'
-
Figure 1: Magnetic Susceptibility vs. Temperature of a Paramagnetic, Ferromagnetic and Antiferromagnetic Substance
\,.. Jv.
'1.
""(..
I
y ./"'
I
I I
,,.
Paramagnetic \ \ Fenomagnetic I
\?point ~ -~
\
L
Antifenomagnetic
)}
j,-1/
ii'//~
~
/
···-
Temperature, K
/
J ~"' . :~ /"
~~ '\
~'
y"...;
1.,;
st?y
The chromium (IV) oxide was carefully inserted into a tape cube. When only the tape was weighed, it was found that its mass was negligible. The chromium (IV) oxide was then inserted inside the tape. Tape was used so that there was the lowest force of friction between the chromium (IV) oxide and the table, so that a more accurate value could be measured. The chromium (IV) oxide was then inserted into a glass test tube, which was placed in a water-filled beaker, which was heated. A retort stand was used to hold a device which served as a video camera, which was used to record the experiment so that the results could be more accurate. A ruler was placed under the retort stand, and neodymium magnets were placed at the O point of the ruler. After the water was boiling, the metal was removed using tongs, and while the temperature was being recorded with a Vernier surface temperatu'fu probe, it was slowly brought closer to the neodymium magnets until the force of attraction overcame the force of static fri_s!W· This was repeated at room temperature, as well as after it had been in the freezer for several minutes. To calculate the static force of friction a I kg mass was placed on top of a wooden block with the tape underneath it. Using a Vernier dual-range force sensor, the force needed to move the block was measured and recorded. This was repeated six times. I' • ,,.
• >JI"'
J'
11
Lancashire
.,,;.,,I""' y,r
l
17
Data Collection I Analysis How data was obtained Before any calculations were made, the force of static friction between the tape and the table / was calculated. Using the graph, the exact value of the peak was determined. The following is a n example of one the graph for trial 7. The peak is clearly defined, and it is the value for the force of static friction:
Figure 2: Force (N) Exerted on a Wooden Block vs. Time (s)
z
i
2
0
4
6
The data were then put into a table.
Table 1: Peak Force Exerted on a Wooden Block Trial 1
. v Peak force (±0.01 N)
3.16
Trial 2 4.13
Trial 3
Trial 4
3.16
Trial 5
Trial 6
3.15
3.23
3.16
l.. C'
0~(..1.
7
~~'i'·-
(
\.v\:- ~~) ~ ............... ~
~
~ uwt ~ ~y\M.&..~
f
)
~--..1....
::;::....
)<.
L - - - . ~ · ~. g .
~"''<..) ~ t <
LJ...v~~ !',.
2.89
± 0.01 N
The uncertainty was calculated by dividing the range of the data by 2:
i-1,Bj- '2,'B
5
(
+ 4.13 + 3.16 + 3.23 + 3.15 + 3.02 + 2.89 b_ = \'25 7
-
3.02
Mass of block: Mass{.0972 ± 0.000 ~g The average of the trials was then taken:
Trial 7
.:,~
~
~
v,.,..,.u-,~~ I
~f__W~
-w~~
~'t..l,..,
,,
18
'7
4.13 - 2.892 "l..
= 0.62 N
• "-="
Since this value is greater than 0.01, this value was used as the uncertainty. •
V \~V
~. x-
>.,_.J'
~
/ ' ':ii-
•
~
~
Using the equation F"'"' = µ,N, where isµ. the coefficient of static friction, and N is the force, the coefficient of static friction was calculated by having N = mg:
~ /
.,,.
3.25
± 0.62
= µ 5 1.0972 ± 0.0001 * 9.81 µ5 = 0.302 N kg- 1 m- 2
,Jr \I>
,<---
~+ ~ v~ -h,
ti
The uncertainty was calculated by adding the relative uncertainties together, which was then multiplied by the value of the force:
0.62 ( 3...2.5
0.00001)
+ 0 _10972 * 0.302
~
= 0.05Z N
The force needed to move the chromium (IV) oxide was then calculated by multiplying the normal force by the coefficient of friction. Since the mass of the chromium (IV) oxide was measured AA ~ to be~.00130±0.0000tg: ~
/·-:,
F = 0.302
± 0.057 * 0.00130 ± 0.00001 * 9.81 F = 0.00385 N
The uncertainty was then calculated by adding the relative uncertainties, and then multiplied by the value of the force to get the absolute uncertainty:
0.057 D....3..0..2
0.00001
+ 0 00130 * 0.00385 = 7.5 * 10- 4
As the temperature probe gave a graph of the temperature over time, the temperature during the procedure needed to be determined. To do this, the average of the most consistent line was taken by adding all of the values together and dividing it by the number of value,.--/ -
~~ f J'- ., l ~ . r,.,:,.,-. <'
J,,....4
(
vr-". ~ ,,_ (
i·~·;
),,:y"',t.
~
~.
\~be o- ...r"\.,..Jt,,.""""'
u,,yl"
¥
\}J"'\
<.:
19 Figure 3: Sample for Run 17: Temperature (K) of chromium (IV) Oxide vs. Time (T)
335 ,
330 i
Q' l1'::,.
325
!
320
r
co
I-
315 '
3100
10
5
15
20
Time (s)
Sample calculation for run 17: 314.88
+ 315.25 + 315.12 + 314.72 + 315.04 + 315.30 + 315.33 + 315.52 + 315.36 + 314.91 + 315.12 + 315.09 + 315.01 + 314.85 + 314.72 + 314.67 ~
3=
,1... 7
The standard deviation was then found by finding the difference of each value from the average, squaring each individual value, then adding up each number, and dividing by the number of numbers and the square root of this value is the standard deviation. The standard deviation value for run 17 was found to be 0.25 K.
~
The vernier website states that its accuracy is "±0.2°C at 0°C, ±0.5°C at 100°C" 12 , so the uncertainty is linear, going from 0.2 to 0.5. The slope was determined using the change in y ~ \.....____, °'\ 1 divided by the cha~in x. Sample:
J, 0.5 - 0.2 slope = _ = 0.003 100 0
The slope was then put into an equation in the form y=mx+b, and the b was determined by substituting (0,0.2) into the equation. OT' T Sample: 0.2 = 0.003(0) + b b = 0.2 Therefore the equation for the uncertainty is ,0. T=0.003(T-273. l 5)+0.2, where T is in temperature in Kelvin. The two were calculated for each trial and the larger uncertainty was used.
/
12
http://www.vernier.com/products/sensors/temperature-sensors/sts-bta/
110
Sample calculation for run 17:
!).T
/
= 0.003(3.14.71 - 272.15) + 0.2 !).T = 0.33 K
To get the value for the distance, the videos were analyzed, and a still frame was taken at the exact moment before the tape starts to get attracted to the magnet. Then, using photo-editing software, the still frame was analyzed, and the exact pixel distance was found, causing the uncertainty of the measurement to be half the relative distance of one pixel, which is 0.08 mm. A sample picture is shown below:
-
ry
Figure 4: Still Frame From Trial 17 of Experiment Setup Depicting Ruler, Neodymium Magnets, and Cr02
"~
7-
-
See Appendix(!) for the raw data table of distance needed to overcome static friction. After the distances were detennined, as explained in the theory section, the formula (11) is used. Sinceµ can be assumed to simply be the permeability of free space, the values can be substituted and solved for H. Below is a sample calculation for trial 17:
0.00385
+ 7.5 * 10- 4 = -
4rr * 10- 7 H 4rr(0.0111
Solving for H;
. ±0.00~
~
-~
y
H = 4.74A m- 1
l'\'\
'iM
-?1'
~ GZ)
~ ""'M.I'\
~
. . .: :. . ~ \A. ~
'\.C,i....l a. c. ~ "'- ~ uv... L·.., ~
Sample calculation for trial 17:
7.5 l:>.H = (
*
0.0008
o00385 + o0111) * 4.74 =
1.26 A m-1
"=
w }.II-'._
.r Jf':.rJ
r ,r vv
~ ..l't..,_
l...}./.K
10- 4
j""~
16~
The uncertainty was then calculated by adding the relative uncertainties. and then multiplying this value by the value of H: "-.
;,
~
~v
~v~
111
This was calculated for every value, and then graphed:
Figure 5: Magnetization of Cr0 2 vs. Temperature
,-;' E
10
:S
7 r-01 H3-\~.--,:;J,.1
H?·t-B-.:i ~.r-1 H,J-;
;---fr·-·-l
300
290
Temperature (Kl
The uncertainty for H is too small to be seen. Using the data from the theory section, the magnetization was divided by the value of the magnetic field. The relative uncertainty of the magnetization is the same as the relative uncertainty of volume, and this was added to the relative uncertainty of the magnetic field, and then multiplied by the value of magnetic susceptibility at that point. Sample calculation of magnetic susceptibility for trial 17:
5.57 * 10- 28 Xv= 4.74 Xv = 1.18 * 10- 28 Sample calculation of uncertainty for trial 17:
7.5 * 10- 4 0.00385
0.0008 0.0111
1-----------1
The data were then graphed:
* 1.18 * 10- 28
= 3.15
* 10- 29
112
Figure 6: Magnetic Susceptibility of Cr0 2 vs. Temperature Auto Fit for: Data Set I Magnetic Susceptibility
4.0E-028--
Xv= AxAB A: 2.832E-042 +/- 4.348E-041
.£ :.0
B: 5.516 +/. 2.686 RMSE: 6.591 E-029
3.0E-028
E(l)
H
()
Ul ::i
U) ()
-~
H
H
·L[__:H~H~. ~:~--;::;-;:;~--;::;-_i__~--------~~~·-~-•-·-~••---:=:-~:H~• :] ~ HH H f---1
c
Ol
co 2
H
2.0E-028-··
1
H
1.0E-028-
H H H
H
H
R
lil-1
H
H
t!:tH
290
300
310
320
Temperature (K)
This graph, shown without uncertainties of magnetic susceptibility, shows an upward trend of magnetic susceptibility as tem~ature increases, which contradicts with the theory. The outlier was ~ then removed:
7 6
Figure 7: Magnetic Susceptibility of Cr0 2 vs. Temperature
~:~
Auto Fit for: Data Set I Magnetic Susceptibility Xv= AxnB A: 6.263E-041 +/- 8.580E-040
2.5E-028
g
H 2.0E-028
:i:i
s.
H
f-1
T
(lJ
iil::i
B: 4.964 +I- 2.397 RMSE: 5.404E-029
H
7
H H
1.5E-028-
H
H
(/)
.S::
ai §,
]
f---1
1.0E-028
H
ro 2
H H
ffl-t
5.0E-029 ··
H:tH
B H
H H
H
290
300
310
320
Temperature (K)
Although it did cause the slope to fall more within the range of the data, the data corresponding to point that are very close to eacn other has an extremely wide range on the axis of magnetic susceptibility. The range of temperature is also extremely small (26 K), which greatly
I 13 decreases the validity of this experiment. The reason that there are two clusters is that the chromium (IV) oxide was heated using boiling water, so the temperature nonnalized at around the same point, causing many values at very similar temperatures. The same process occurred when cooling the Cr02, leading to a cluster of values at the lower end of the end as well. The following is the same graph with the uncertainties of magnetic susceptibility included:
Figure 8: Magnetic Susceptibility of Cr0 2 vs. Temperature
---.
~ ;g
a_
6.0E-028
Auto Fit for: Data Set I Magnetic Susceptibility Xv= Ax'B A: 2.604E-043 +/- 3.993E-042 B: 5.933 +i- 2.681 RMSE: 6.585E-029
4.0E-028
Q) (.) U)
::::;
(!)
.S?
m c 0)
cu 2
20E-028[
-
ta• 83
fffi~
!
f
•
J
O.OE+OOO 290
300
310
320
Temperature (K)
With the included uncertainties, a more positive trend can be seen. However, its validity is put into question by the extremely large uncertainties.
--
Shown without the outlier:
7
Figure 9: Magnetic Susceptibility of Cr0 2 vs. Temperature
I 14
Auto Fit for: Data Set I Magnetic Susceptibility
3.0E-028 ·
g ~ a.
u
Xv= AxAB A: 6.263E-041 +/. 8.SBOE-040
f- I
2.0E-028--
{f)
T
_[
::J (f)
u
•li1J.!~=----;-f-,i=----~~t--tf11:~--,~I--1-----i~·
~ c
gi
2
1.0E-028
"'1
290
300
310
320
Temperature (K)
The uncertainty of magnetic susceptibility is far too large to provide any sort of insight as to whether or not this relation is valid. This is explored fmiher in the conclusion section.
Conclusion The research question "How does the temperature of chromium (IV) oxide affect its magnetic susceptibility?" was analyzed. The temperature of chromium (IV) oxide was measured while it was being slowly pushed towards a magnet. After performing 40 trials with a variety of temperatures, the magnetic susceptibility of the chromium (IV) oxide was graphed versus temperature, providing a graph with error bars that are far too big to provide any useful information. According to the theoretical model, the graph should look as follows:
I
Figure 1: Magnetic Susceptibility vs. Temperature of a Paramagnetic, Ferromagnetic and Antiferromagnetic Substance 13
.
~
vv'-~
(' viy -:./ ./"t"'\ ~
~
J
13
Lancashire
I 15
I \ Ill . aramagnetlc P \ ,, \ Ferromagnetic
"\
~
\ . \
_:;!i.e point
·~lit~~
L"~ Antiferromag:netic
~""
Temperature, K
J-,JY"'
,.,o
~ ,e~ ~
·--
It should be an asymptotic graph with a distinct change of slope. Since the data did not go
\ above the curie point of Cr0 2, it should be a curve with a negative slope. However, since the range of temperatures is so low, it is likely that there was not nearly enough data acquired. The range of data in temperature is extremely low, indicating that a higher sample size should have been used. The values of magnetic susceptibility for very similar temperatures are also extremely different, indicating. As well as that, the uncertainties are extremely large, causing any line of best fit to hardly be valid at all.
Sources of Error It is evident that there were some major sources of error in this experiment which caused the data to not follow the theoretical model.
Temperature was sometimes difficult to determine because it varied~ .::=7 -.t 1 There was some error associated with the way that the average temperature was determined. Since some of the graphs for the temperature were not consistent, it meant that the difference in temperature varied significantly, also meaning that the temperature was not as accurate as it could have been. This was likely a small source of the random error, and could have been reduced by using a different sensor, as explained further on . .,.....•
1
~vl!,J( cJ..
lY" ""~
,J- .,,.,
~ ~ J.
t- v..r"' ~ .
~ ~ .,.,JM.)
- ~ Y"
"
•
Difficult to always keep sensor on tape Another source of random error related to the way that the temperature was determined is that it was at times very difficult to keep the temperature sensor touching the tape, since it needed to be pushed very gently, which made it hard to accurately measure the temperature since the sensor needed to be firmly pressed against the object. This could have caused some of the graphs' temperatures to vary, as explained previously. This could be reduced by using a contact sensor inside which the metal can be placed, causing the temperature to be constantly recorded.:,....-The distance may not have been entirely accurate W- ~ ~~ The distance recorded to be the dist~ that overcame the force of static friction may not have been the exact distance, as even the camera is not fast enough to catch minute differences in the position, as some camera stills were too blurry to determine the exact distance, a clearer one was used. Even very small differences in distance could have dramatically changed the distance. This was •
/'LO
===;:>
-+ ( ) ,.
I 16 likely a source ofra~ error that was quite large, and could have accounted for the large discrepancy in the data. It could be reduced by using a slow motion camera, which would be able to record more frames per second, and thus be able to show more clearly the exact moment that the force of static friction is overcome. ~
•
Declined rapidly when not heated/cooled Another significant source of en-or is the rapid decline ( or increase) in temperature when it is removed from the apparatus. It is likely that chromium (IV) oxide has a low specific heat capacity, so the substance rapidly undergoes changes in temperature. This causes the data points to be very concentrated near room temperature, and very spread out between 300k and 290k. As such, the range in temperature is only 26K, so that is another very large source of systemic en-or, as it causes the sample size to be very small, restricting the validity of the data. This could be reduced by performing the experiment in an environment that consistently provides (or takes away) energy, allowing it to stay at a consistent temperature. ~ •
Premise of experiment is wrong (temp of tape does not equal temp of metal) The premise that the experiment takes for measuring the temperature~ also~wrong. It is assumed that the temperature of the tape is the exact same as the temperature of the chromium (IV) oxide inside of it. Although much of the energy may be transferred, it is possible that not all of it is, meaning that the values used for the temperature of the metal may be wrong. Although this does not change any of the random error, it does impact the systematic error of the experiment. This could be reduced by using a temperature sensor that is in direc~ct with the metal, as it would yield results that are more accurate..:,......--•
Pushing tape may cause wrong distance The tape was pushed using the temperature sensor, as this was thought to give the best reading. However, it was found that in several trials, the act of pushing the metal caused it to be attracted to the magnet prematurely, and although these trials were redone, the error was still present. This could be reduced by utilizing a machine that would be able to push the chromium (IV) oxide in small increments, making the measurement of the distance more exact.......---•
Assumes that entire area of tape is on the ground
It was assumed in the model and calculations that the entirety of the tape was on the ground, although practically this is likely to not be true. This systematic source of error likelx made the data lower than what it should have been. This could be reduced by using a larger area of tape, causing the area not touching the ground to be more and more negligible. However, this means that it would also require an electromagnet, as the force required to move it would be quite large. _.,,.,.,..
•
Assumes that chromium (IV) oxide is covering the entire volume of the tape The model used assumes that the chromium (IV) oxide is covering the entire volume of the tape. In reality, the chromium (IV) oxide was not the entirety the volume; there was inevitably some air in it. This systemic source of error probably negatively skewed the data. This could be reduced by using heat shrink wrap, which would be wrapped around the chromium (IV) oxide, and then heated, causing negligible air presence in the p l a s t i ~ Unfortunately, because of the multiple large sources of error, and the significant unce11ainties, this experiment did not support or refute the hypothesis. However, ifredone, it should be done on a much larger scale, using an electromagnet, since many of the sources of error can be
I 17 greatly reduced by having a larger-scale experiment, since the uncertainties would be much lower, and many of the other assumptions would be more valid.
<, ~
~
-~ I
'i ~
\r\....~ /\.A)
l'i
vVv\..l..AA
~ 1.,...,..· \,.:' c. ~1.. :
(.,\
~
)
Appendix
~
~1
I 18
,._;/ y
J
1. Raw data table of temperature and distance Trial Temp (K) Distance± 0.0008 m
1
306.88
0.01335
2
314.28
0.0084__
3
317.92
0.01005
4
312.37
0.0108_
5
298.12
0.0075 _
6
298.08
0.01155
7
298.59
0.0141
8
299.03
0.0117
9
299.41
0.0129
10
310.25
0.0129
11
310.62
0.009~
12
313.98
0.0075
13
313.58
0.01215
14
311.7
0.0102
15
302.87
0.00825
16
302.72
0.01121_
@
314.71
0.0111
18
314.48
0.006
19
310.6
0.01035
20
308.44
0.0087
21
311.62
0.00915
22
298.56
0.01545
23
298.59
0.01305
24
298.68
0.0141
25
298.78
0.01305
26
294.61
0.00945
27
295.46
0.0123
28
292.61
0.01095
29
293.95
0.01515
30
293.61
0.01005
~
-
-
f' .,,.,
....
.--
.,.,....
V""" /
?}
v
\'
"""',,.;-
\\·' ,,y~ t,Y' .
Jc::
Ill
J
I 19 Trial Temp (K) Distance± 0.0008 m 31
293.79
0.0087 -
32
294.47
0.00915
33
294.34
0.0108
34
294.2
0.01575
35
292.52
0.00825
36
291.92
0.00915
37
292.55
0.01095
38
292.07
0.01905
39
294.27
0.01365
40
293.13
0.01275
j
I 20
References / Guinier, A., & Jullien, R. ( 1989). The solids/ale: from superconduc/ors lo superalloys. Chester, England: International Union of Crystallography;
/
/ Editors of Encyclopa:dia Britannica. (n.d.). magnetic susceptibility (physics).Encyc/opedia Brilannica Online. Retrieved September 21, 2014, from http://www.britannica.com/EBchecked/topic/357313/magnetic-susceptibility ,./
/
Fundamental Relationships. (n.d.). Basic Relationships. Retrieved September 21, 2014, from http://geophysics.ou.edu/soli d_ earth/notes/mag_basic/mag_basic.html Hoppe, J. I. (1972). Effective magnetic moment. Journal of Chemical Education,49(7), 505.
,./
Mahajan, A. S., & Rangwala, A. A. (1988).E/eclricity and magnelism. New Delhi: Tata McGraw-Hill . ....,
v
Kittel, C. (2005). lnlroduclion lo solid s/a/e physics (8th ed.). Hoboken, NJ: Wiley. Levy, R. A. ( 1968). Principles of solid state physics. New York: Academic Press.
i / Surface Temperature Sensor. (n.d.). > Vernier Sof/Ware & Technology. Retrievfct' September 21, 2014, from http://www. vernier. com/pro ducts/ sen so rs/tern pera lure-sensors/ sts-bta/ . / Lancashire, R.(2011, May I). Magnetism of first-row transition metal complcxes ..Magnellsm offirsl-row lransilion me/a/ complexes. Retri,;;'ed September 21, 2014, from http://wwwchem.uwimona.edu.jm/courses/magnetism.html /
Bhavikatti, S.S., & Rajashekarappa, K. G. (1994). Engineering mechanics. New York: J. Wiley.