1
Effect of N deposition on decomposition of plant litter and soil organic matter in forest systems Björn Berg and Egbert Matzner
Environ. Rev. Downloaded from www.nrcresearchpress.com by 150.254.164.85 on 04/19/11 For personal use only.
Abstract: The effects of nitrogen (N) deposition on plant litter and soil organic matter decomposition differ depending on the stage of decomposition (early, late, and final stages). The effects can be divided further into direct and indirect ones. Direct effects: additions of ammonium and nitrate to fresh, newly shed litter stimulate the initial decomposition of celluloses and solubles. By contrast, addition of the same compounds to humus (final stages) clearly suppresses activity. This was seen in all studies reviewed and for several types of humus. Indirect effects: long-term deposition leads to increases in litter concentrations of N and other nutrients. This N in litter forms “natural” organic compounds and the resulting effects are similar to those resulting from natural variation among litter types. Thus, initial decomposition is generally higher for N (nutrient) rich plant litters than for litters with a lower N (nutrient) content. In later stages, at which lignin-degradation rates regulate litter decomposition, N has a retarding effect on decomposition. Significant negative correlations have also been found between N concentrations in humus and respiration rate. There probably is a sink for deposited N in the humus. We may conclude that N storage in humus is regulated by a positive feedback mechanism. Raised levels of N resulting from N deposition cause more humus to be left in the system, and the resulting lower levels of Mn further retards humus decomposition, thus leading to an increased storage of N in humus. Thus, when calculating critical loads it would be incorrect to assume that N pools in the humus remain at a steady state. Key words: nitrogen, deposition, C mineralization, litter, humus, mycorrhiza. Résumé : Les effets de la déposition d’azote (N) sur la décomposition des litiéres et de la matière organique de sol différent selon le stade de décomposition (stades hâtif, tardif et terminal). Les effets peuvent être de nouveau divisés en effets directs et effets indirects. Effets directs : les additions d’ammonium et de nitrate à la litière fraîche, nouvellement déposée, stimulent la décomposition initiale des celluloses et des substances solubles. Au contraire, l’addition des mêmes composés à l’humus (stades terminaux) supprime nettement l’activité. Ceci a été constaté dans toutes les études revues par les auteurs, et pour plusieurs types d’humus. Effets indirects : la déposition à long terme conduit à une augmentation des teneurs en N et autres nutriments. Cet azote de la litière forme des composés organiques «naturels» dont les effets sont semblables à ceux qui résultent de la variation naturelle entre les différents types de litière. Ainsi, la décomposition initiale est généralement plus importante pour les litières de plantes riches en N (nutriments) que pour les litières contenant moins de N (nutriments). Aux stades avancés, alors que les taux de dégradation de la lignine régularisent la décomposition de la litière, l’azote retarde la décomposition. Des corrélations négatives significatives ont également été observées entre les teneurs en N dans l’humus et les taux de respiration. Il y a probablement un puit («sink») pour l’azote déposé dans l’humus. Les auteurs tendent à conclure que l’accumulation de l’azote dans l’humus est régularisée par un mécanisme de rétroaction positive. Les teneurs élevées en N provenant de la déposition de l’azote entrainent une accumulation d’humus dans le système, et la diminution des teneurs en Mn qui en résulte retarde encore plus la décomposition de l’humus, ce qui conduit à une augmentation de l’azote accumulé dans l’humus. Ainsi, lorsqu’on calcule les charges critiques, il ne serait pas correct d’assumer que les réserves d’azote dans les humus demeurent à l’état constant. Mots clés : azote, déposition, minéralisation du carbone, litière, humus, mycorrhiza. [Traduit par la rédaction]
Received March 21, 1996. Accepted October 16, 1996. Björn Berg1,2 and Egbert Matzner. Department of Soil Ecology, Bayreuther Institut fuer Terrestrische Ökosystemforschung, P.O. Box 101251, University of Bayreuth, D–95440 Bayreuth, Germany. 1 2
Author to whom all correspondence should be addressed. Present address: Department of Forest Soils, P.O. Box 7001, SLU, S–750 07 Uppsala, Sweden.
Environ. Rev. 5: 1–25 (1997)
© 1997 NRC Canada
Environ. Rev. Downloaded from www.nrcresearchpress.com by 150.254.164.85 on 04/19/11 For personal use only.
2
1. Introduction 1.1. Background 2. Litter chemical composition—influence of N additions 2.1. General comments 2.2. N pollution transects 2.3. Additions of N as a fertilizer and as experimental deposition 2.3.1. General 2.3.2. Scots pine 2.3.3. Common beech 2.3.4. Norway spruce 2.3.5. Comparison 2.4. Secondary effects of N additions 3. Some chemical components and their degradation 4. N effects on decomposition rates of litter and humus 4.1. A model, based on the natural variation in N, for systematizing the effects of N on decomposing litter and humus 4.1.1. General 4.1.2. Initial decomposition stages 4.1.3. Later stages of decomposition 4.1.4. Final stages of decomposition 4.1.5. Humus 4.1.6. Humus and mycorrhiza 4.2. A distinction between direct and indirect inflows of N 4.2.1. Direct inflows 4.2.2. Indirect inflows 4.3. Direct effects of added N 4.3.1. Chemical effects 4.3.2. Biological effects on newly shed litter 4.3.3. Biological effects on humus 4.3.3.1. Directly measured effects on N deposition 4.3.3.2. Additions of ammonium and nitrate salts 4.3.3.3. Urea additions 4.3.4. Biological effects on humus— mycorrhiza 4.4. Indirect effects on the decomposition of litter and humus caused by a change in substrate quality 4.4.1. Early decomposition stages of plant litter 4.4.2. Later stages of plant litter decomposition 4.4.2.1. Biological regulation 4.4.2.2. Chemical mechanisms 4.4.3. Final stages of litter decomposition and humus 4.5. Direct versus indirect effects—two mechanisms? 4.6. Effects resulting from changes in the forest floor 4.6.1. Experimental N additions 4.6.2. Observations following ambient N deposition 4.6.3. Effects observed on litter decomposition 4.6.3.1. Early stages 4.6.3.2. Late stages
Environ. Rev. Vol. 5, 1997
2 2 3 3 3 3 3 4 4 5 5 5 6 7 8 8 8 8 9 10 11 11 11 11 11 11 12 12 12 12 14 14 14 14 15 15 15 15 15 16 16 17 17 17 18
4.6.3.3. Final decomposition stages and humus 5. Fate of the added nitrogen 5.1. Natural systems 5.2. Systems with N additions 5.3. Release of N 6. Conclusions 7. Acknowledgements 8. References
18 18 18 20 21 22 22 22
1. Introduction 1.1. Background Among the forest soil nutrients, N stands out for a number of reasons, a prominent one being its origin. In forest systems that have developed since the last glaciation, most nutrients have been supplied through soil weathering. By contrast, N has been added through the fixation of N2 from the atmosphere. This process occurs slowly in most forest systems, which may explain why mechanisms for storage and conservation of N have developed in some systems. Nutrient-poor systems (e.g., the typical north European nutrient-poor pine forest), in particular, can be expected to develop such biological and chemical mechanisms of nutrient conservation. In sharp contrast, such mechanisms would not be expected to develop in the soils of N2-fixing alder forests, which have a strong and continuous inflow of N. The deposition of N on forest soils may cause an imbalance in soil nutrient storage and disturb one or more storage mechanisms. With annual inputs ranging from 15 to 50 kg⋅ha–1 in central Europe, the amounts added to a soil of a nutrient-poor forest will far exceed the annual contribution by the only natural source, that is, N2 fixation. Moreover, the N deposition may cause an imbalance in nutrient composition far more serious than that resulting from an N surplus and the consequent ion imbalance. Thus, the effect on the microbial community may in the long run be of a higher significance than the effect on, for example, ion balance. Deposition reaches the ground in the form of both ammonium and nitrate, both forms of which are readily available to microorganisms and, in addition, highly reactive from a chemical point of view. The spatial distribution of N deposited on a forest soil is far from even (Manderscheid and Matzner 1995). This kind of observation may, of course, illustrate a general variation in effects on the soil system. Although the amount of N supplied through forest fertilization can be as high as 200 kg⋅ha–1 (applied about three times over a rotation), only a fraction may stay in the system. As based on available literature, the range recovered from the top soil is from 9 to 30% (Tamm et al. 1998; Nömmik and Möller 1981; Miller 1979). We estimated 11% to be a weighted value, and using that, only about 22 kg on each fertilization occasion should stay in the system. In many systems this corresponds to 1 or a few years input via deposition. Although fertilizer is applied to a relatively low number of forest systems, also such N additions clearly need to be considered in this context. Traditionally in the characterization of plant litter and humus a great deal of weight was placed on their N concentrations. Many textbooks emphasize the generally stimulating © 1997 NRC Canada
3
Environ. Rev. Downloaded from www.nrcresearchpress.com by 150.254.164.85 on 04/19/11 For personal use only.
Berg and Matzner
effect that N has on microbial decomposition and the important influence that the C:N ratio of organic matter has on its decomposition rate (cf. Alexander 1977). The prevailing theory is that when the C:N ratio is below a certain threshold value, decomposition leads to a net mineralization of N. By contrast, above the threshold value, a lack of N tends to retard microbial activity. However, in an extensive study by Fog (1988), the addition of N to organic matter with a high C:N ratio did not have any general long-term stimulating effect on microbial activity. In some cases N addition actually reduced microbial activity. He cited approximately 60 reports published during 1934–1987 in which N addition had either no effect or a negative one. These unexpected results led us to make an extensive search for more recent reports of similar results in the literature. N additions to soil can affect plants and their litter in several ways and can also influence litter decomposition processes and other microbial processes in the humus. This influence may be considerable and Aber et al. (1991) concluded that such factors as litter quality may be one of the most important ones for determining the equilibrium of a system under N deposition. In this paper we have reviewed the literature pertaining to the influences of N deposition on the chemical composition of litter as well as on decomposition of litter and humus. Our focus has been on forest systems and on fresh litter, as well as humus. We have first discussed the effects of N deposition and fertilization on litter chemical composition, and thereafter looked at the influence of the combined chemical changes on decomposition and humus formation, as well as on the fate of the added N. In the decomposition process, we can distinguish at least three stages. In several litter types, final decomposition stages have been observed, and we will thus see that N concentrations in litter may directly influence the fate of the organic matter. To get a general picture of the effects of N deposition in a particular region, we have focussed our discussion and conclusions on three important North European tree species, namely, Norway spruce, Scots pine, and common beech. Owing to the wealth of data on Scots pine, the Scots pine system was used as a model in our review. However, we are aware that other systems, such as stands of alder or even common beech, may behave very differently.
2. Litter chemical composition—influence of N additions 2.1. General comments Nitrogen deposition and the fertilization of forests with N add substantial amounts of N to the forest floor, which leads to increased soil concentrations of this nutrient. As a result, N uptake by plants increases, resulting in higher concentrations in the different plant parts, including the foliage (below). At the withdrawal of nutrients (including N) from the needles/ leaves, which occurs just before they are shed, a certain fraction of the foliar nutrients is withdrawn, resulting in a lower concentration in the litter as compared with the green leaves. This means that litter from a tree in a stand subjected to either deposition or N fertilization will have a higher N concentration as compared with an undisturbed system. We have investigated two kinds of data from the literature: data resulting from studies on the effects of N deposition on litter chemical composition and data resulting from similar
studies on the effects N fertilization where the latter is regarded as experimental N deposition. 2.2. N pollution transects Litter chemical composition has been studied in N pollution gradients. For example, Makarov and Krasilnikova (1987) studied the effects of N pollution on leaf litter from white birch (Betula pubescens), aspen (Populus), and grey alder (Alnus incana) along a transect with plots up to 40 km from the emission source. For birch leaf litter, there was a clear increase in N concentration from 1.29% N at the control plot to 2.24% N in litter from a plot close to the N emission source. For aspen leaf litter, the tendency was similar with 1.23 and 2.22%, respectively. On the other hand, concentrations of N in leaves of the N2-fixing grey alder remained within the range of 2.6–2.7% N and showed no correlation with distance to the emission source. In the same study P concentrations were proportional to those of N for both birch and aspen leaf litter, indicating that there was a certain balance in the trees’ nutrient uptake although only N had been added. The extent of such a concentration increase of nonadded elements in the leaf litter should depend on the availability of these nutrients, and such increases are probably not a general phenomenon. It was also found that for the grey alder leaves, concentrations of P increased with decreased distance to the emission source, although the N remained fairly constant. For alder the N is normally supplied through N2 fixation, but in this case fixed N was replaced by the N in deposition, resulting in no net change in terms of total N concentration. This has been observed also in other experiments with alder (U. Granhall, personal communication). If this is a general phenomenon, that would mean that the effect of N deposition on the N concentration in litter from N2-fixing plants would be nil. However, if other nutrients are taken up along with N, this could result in a pronounced change in the overall composition of the litter. In a North American transect, Pregitzer and Burton (1992) investigated the concentration of N in sugar maple (Acer saccharum) litterfall. Their transect was 800 km long with clear climatic differences between the extreme sites and a range in total deposition of between 9 and 13.5 kg N⋅ha–1⋅year–1. They did not find any relation between deposition rate and N concentration in the foliar litter or in green leaves. However, when comparing the total N deposition with certain other nutrients, significant relationships were found for S, Ca, and K. This suggests that an effect of N deposition on leaf litter material need not necessarily be manifested as a significant increase in N concentration. Instead, it could result in higher concentrations of other nutrients. In another American study using green needles of red pine (Pinus resinosa), Bockheim et al. (1989) investigated an N pollution transect with an annual input of between 9 and 15 kg NO3⋅ha–1⋅year–1. Although they found a significant difference in N concentrations in green needles between the extreme sites, the range was narrow (from 1.14 to 1.04%). 2.3. Addition of N as a fertilizer and as experimental deposition 2.3.1. General Additions of N to soils have been performed to simulate N © 1997 NRC Canada
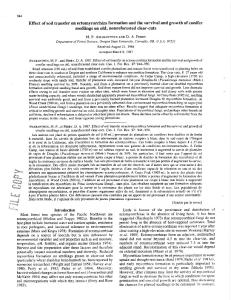
4 Fig. 1. Relation between annual dosage of N fertilizer and concentration of N in Scots pine needle litter (data from Berg and Staaf 1980).
Environ. Rev. Vol. 5, 1997 Table 1. Correlation coefficients (r) for linear relations between concentrations of different nutrients and lignin in Scots pine needle litter collected in plots given three different dosages of N fertilizer (viz., 0, 40, 80, and 120 kg N⋅ha–1⋅year–1), as well as data from needle litter collected in a very nutrient-poor stand (recalculated from Berg and Staaf 1980). Component
Environ. Rev. Downloaded from www.nrcresearchpress.com by 150.254.164.85 on 04/19/11 For personal use only.
Lignin Lignin N P S K Ca Mg
— 0.719**
–0.853**
N
P
S
— 0.742** 0.847** 0.669** –0.772**
— 0.965*** 0.949***
— 0.879**
Note: *, p < 0.05; **, p < 0.01;***, p < 0.001. Only significant relationships are shown.
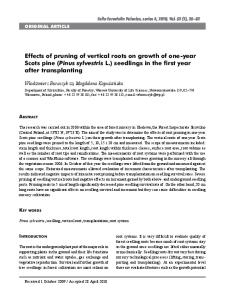
Fig. 2. Linear relations between concentrations of N and S in Scots pine needle litter from an N-fertilized plot (data from Berg and Staaf 1980).
deposition. Such experiments may be done by small daily additions but also by direct experiments with N fertilization. The latter may be useful to interpret the effects, keeping in mind that such heavy additions should be interpreted with care. With experimental dosages as high as 100–500 kg N⋅ha–1⋅year–1, it appears that the main part of the supplied N left the system relatively quickly, with a low percentage, in the range from 9 to 30%, being recovered from the top soil (Tamm et al. 1998; Nömmik and Möller 1981; Miller 1979). We have assumed a weighted efficiency of 11%. This heavy outflow can be attributed in part to the fact that, with the addition technique used, the full amount of N fertilizer is added in a period of hours. As
discussed by Tamm et al. (1998), there is a dynamics in recovery percentage in soil depending on the magnitude of the dosage and the number of additions, namely, the level of saturation. Using the observations by Nömmik and Möller (1981), we may estimate that 20–12% may be recovered with additions in the range from 150 to 500 kg, meaning that say 20–60 kg⋅ha–1 would remain in the soil, which corresponds to deposition amounts. Long-term fertilization experiments could thus be of value in illustrating long-term deposition effects. 2.3.2. Scots pine The addition of N will result in increased uptake by the trees and, consequently, in enhanced concentrations of N in the freshly formed litter. This has been observed by Miller and Miller (1976) and later by Berg and Staaf (1980). The latter, using Scots pine needle litter from a fertilization experiment (Tamm et al. 1974) (cf. dosage given by Tamm 1991) found that N additions at an annual dosage of 80 kg N⋅ha–1 resulted in a statistically significant increase in litter-N concentrations, whereas the dosage of 40 kg⋅ha–1⋅year–1 did not have any significant effect (cf. Fig. 1). A clear relationship was seen between dosage and litter N concentration (n = 8; r = 0.949; p < 0.001). The range of the increase measured over several years at one experimental site was from about 3.6 to 8.5 mg N⋅g–1 needle litter. The variation in N concentration was accompanied by variation in concentrations of other nutrients as well, producing a balanced nutrient composition. Thus P, S, and K concentrations showed positive linear relations to the N concentration, whereas Ca showed a negative relation, and there was no significant relation found for Mg (Table 1; Fig. 2). 2.3.3. Common beech In a study in south Sweden, Bergkvist and Folkeson (1992) added ammonium nitrate to the soil in a forest of common beech (Fagus sylvatica). Dosages of 66 and 198 kg⋅ha–1 resulted in increases in N concentrations in leaf litterfall of from 11.5 mg⋅g–1 in the control plot foliage to 12.5 and 13.3 mg⋅g–1 for the two treatments, respectively. The difference between the control and high-dosage treatment was significant. We may compare their experiment to those of Tamm (1991) and Tamm © 1997 NRC Canada
5
Berg and Matzner Table 2. Correlation coefficients (r) for linear relations between concentrations of different nutrients and lignin in Norway spruce needle litter collected in control plots and plots annually given two different dosages of N fertilizer (120 and 180 kg⋅ha–1; cf. Tamm 1991) (data from Berg and Tamm 1991b).
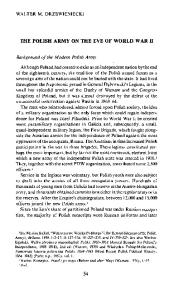
Fig. 3. Linear relations between concentrations of N and lignin in Norway spruce needle litter sampled in N-fertilized plots (from Berg and Tamm 1991a). ×, control plots; n, N2 plots; h, N3 plots.
Environ. Rev. Downloaded from www.nrcresearchpress.com by 150.254.164.85 on 04/19/11 For personal use only.
Component Lignin N P S K Ca Mg Mn B Cu Al Zn Fe
Lignin — 0.481 –0.332
N
P
S
K
Ca
— –0.513
—
— — 0.826
—
0.738
–0.539
–0.382
–0.691
–0.459 –0.761
–0.521 –0.564
–0.531 –0.387
0.760
–0.428 –0.592
–0.509
0.954
Note: Significance level at least p < 0.05. n = 30.
et al. (1974) and conclude that with an assumed efficiency of 11% the deposition simulated by Bergkvist and Folkeson (1992) was low. By using their data we also found that concentrations of S in litter were only slightly affected, but that those of Mn clearly decreased with increasing dosage of N. 2.3.4. Norway spruce In their paper, Berg and Tamm (1991a, 1991b) compared the chemical composition of needle litters collected in control plots with those collected in plots fertilized with two different levels of N. One systematic sampling was made in each of 2 consecutive years, and in both sets concentrations of lignin and the nutrients N, P, S, K, Ca, Mg, Mn, Al, Fe, Zn, and Cu were compared (Table 2). There were evident differences in chemical composition between years, with differences found in concentrations of lignin, N, and Ca, among other substances. Practically all of the investigated nutrients were influenced by the addition of N. It is of special interest to note that as the fertilizer dosage was increased, concentrations of Mn appeared to decrease, whereas those of Ca increased. Unfortunately, no studies on natural variation have been found in the literature. 2.3.5. Comparison We may compare the magnitude of some different experimental additions of N, measured as changes in N concentrations in foliar litter. Using the knowledge that just a fraction of the N from heavy fertilizer applications stays in the system, we may estimate the amount remaining in the soil after an N addition such as fertilization and compare relative increases in N concentration in foliar litterfall between treatments (Berg and Tamm 1991a; Berg and Staaf 1980). In the fertilization experiments with high annual dosages, the amount of N retained should have corresponded roughly to the amount of deposition actually measured and we may probably use the chemical composition of leaf and needle litter from such experiments as representative for stands with deposition.
2.4. Secondary effects of N additions Concentrations of lignin in Scots pine and Norway spruce litter also varied with the dosage of N. For the latter species an increase with dosage was seen over the full range of application rates, from about 300 to 407 mg⋅g–1 (Fig. 3). Litter concentrations of N appeared to be largely proportional to the dosage of fertilizer, ranging from 4.2 mg⋅g–1 in control plots to 18.3 mg⋅g–1 in high-dosage plots. A similar relation was found for Scots pine (Table 1). This increase in lignin concentration may relate to a lack of B in the soil (B. Berg, unpublished; Dugger 1983; Lewis 1980). The high dosage of fertilizer forced the trees to grow so fast that the available pool of certain essential nutrients in the soil was exhausted. For instance, the growing trees also showed symptoms of B deficiency, apparently because weathering was unable to provide an adequate supply of this micronutrient. Boron is important because it is required by an enzyme that transports phenols out from the needles (Dugger 1983; cf. Lewis 1980). A lack of B thus resulted in an accumulation of phenolics in the needles, leading in turn to a higher synthesis of lignin. In his review, Fog (1988) presented the interesting hypothesis that there is a positive relation between the N concentration of a given litter and its content of water-soluble substances, as well as the amount of water-soluble substances released upon decomposition of the litter. The studies referred to are based on comparisons of different litter types with or without additions of N. Although such an hypothesis is interesting, it was not strongly supported by findings covered in his review. The pool of water-soluble substances being built up by intermediate decomposition products (e.g., sugars) is highly degradable © 1997 NRC Canada
6
Environ. Rev. Vol. 5, 1997 Table 3. Some comparisons between concentrations of N and cold-water-soluble fractions, as well as ethanol-soluble fractions, in the newly shed litter of some conifers (data from Berg and Staaf 1980; Berg and Tamm 1991a; Berg and Lundmark 1987).
Environ. Rev. Downloaded from www.nrcresearchpress.com by 150.254.164.85 on 04/19/11 For personal use only.
Species Water-soluble substances versus N concentration Scots pine Norway spruce Scots pine and Norway spruce Scots pine, Norway spruce, and lodgepole pine Ethanol-soluble substances versus N concentration Scots pine Norway spruce Scots pine and Norway spruce Scots pine, Norway spruce, and lodgepole pine
n
r
p
10 30 40 47
–0.673 –0.114 –0.706 –0.316
<0.05 NS <0.001 <0.05
10 30 40 47
–0.809 –0.709 –0.165 –0.575
<0.01 <0.001 <0.05 <0.001
Note: NS, not significant.
Fig. 4. Relation between initial concentrations of ethanol-soluble substances in Scots pine (d) and Norway spruce (s) and N concentration in the litter (cf. Table 3) (data from Berg and Staaf 1980; Berg and Tamm 1991b).
species combination (Fig. 4). The relationship for Scots pine needle litter was significantly different from that of Norway spruce. Thus both of them indicated species-specific relationships. This would mean that the litter more rich in N would have lower levels of both water solubles and phenolic-based polymers. Our observation was also supported by the findings of Granhall and Slapokas (1984) with Salix caprea leaves. They reported that concentrations of ethanol extractives were negatively related to N levels.
3. Some chemical components and their degradation
and could thus vary considerably over short time intervals. Besides, the size of a pool would not indicate the formation rate. We investigated existing data on some newly shed needle litters, some of which were from N fertilization experiments, to test Fog’s hypothesis. For Scots pine needle litter collected in an N-fertilized stand, we found a negative relationship between initial levels of N and concentrations of water solubles (p < 0.05; Table 3). The relation for Norway spruce needle litter was similar, although it was not significant. A combination of the existing data sets gave negative relationships for Scots pine plus Norway spruce litter, as well as for these two litters plus that of lodgepole pine (Table 3). Relationships to N concentrations were also negative for ethanol-soluble substances. Thus for Scots pine we obtained a correlation coefficient of –0.809 (n = 10 and p < 0.01). A similar and highly significant relationship was found for the Norway spruce needle litter, as well as for the combinations of both Scots pine and Norway spruce needle litters and the three-
Quantitatively, the largest components of plant litter are cellulose, different hemicelluloses, and lignin, all of which are found in plant fibre. Cellulose is a carbohydrate polymer made up of glucose, while hemicelluloses are made up of, for example, xylose, mannose, galactose, and arabinose. The celluloses and hemicelluloses are degraded by large groups of microorganisms, including both aerobic and anaerobic bacteria and different groups of fungi. Lignin is decomposed by aerobic organisms. These organisms and their degradation mechanisms have been the subject of extensive reviews (e.g., Eriksson et al. 1990). Whereas the organisms able to degrade polymeric carbohydrates have been well studied, less is known about the organisms degrading lignin. The lignolytic process is restricted to aerobic organisms, and there are two main kinds of degradation, called brown rot and white rot. Degradation carried out by the so-called brown-rot organisms is incomplete, since all they do is to initiate degradation by removing methoxyl groups from the lignin structure. Among the white-rot organisms, which are able to degrade the lignin completely, a number of lignolytic systems are used. A case study carried out on the fungus Sporotrichum pulverulentum revealed some important mechanisms by which the degradation of lignin is regulated (Keyser et al. 1978; Eriksson et al. 1990). Fog (1988) presented an overview of the role of microbial succession in decomposing litter and discussed its implications in lignin degradation. However, it may also be useful to comment on the influence of whole fiber on substrate decomposability. In the freshly fallen litter of a given species, the fibre © 1997 NRC Canada
7
Berg and Matzner
Environ. Rev. Downloaded from www.nrcresearchpress.com by 150.254.164.85 on 04/19/11 For personal use only.
Fig. 5. A model proposed for describing litter decomposition to humus and some rate-regulating factors. The model, based on that by Berg and Staaf (1980), was developed using data from Berg et al. (1987, 1993, footnote 3).
Fig. 6. An overview of some different kinds of effects of N on the decomposition of litter and soil organic matter. An asterisk close to a box indicates that there is good information available in the literature, while an asterisk within parentheses indicates that very little information is to be found.
may contain a large number of soluble compounds (cf. Berg et al. 1982), whereas the insoluble polymers were lower in numbers. In the fibre wall the celluloses are partly integrated with lignin and partly free (cf. Fig. 5). The relative proportions of these two fractions may affect the response of the substrate during decomposition. The celluloses not matrix-bound to lignin represent a more available and easily hydrolyzed substrate compared with the lignin and cellulose bound to it in a matrix. This part of the fiber is attacked by other organisms and responds in different a way compared with the fraction in which lignin regulates the mass-loss rate; thus regulating mechanisms also differ between these two fractions.
In decomposing litter the chemical components are degraded in a certain sequence (cf. Berg et al. 1982; Berg and Staaf 1980). The heterogeneous group of microorganisms that invades the litter initially decomposes the water solubles in the nonmatrixed part of the cellulose and hemicelluloses, and finally, the complex of interwoven holocellulose and lignin is attacked. Since lignin is generally the most recalcitrant component in this matrix, its decomposition regulates that of the whole structure (cf. Fig. 5). This seems to apply to soil systems that are undisturbed and in which a natural succession of microorganisms degrade the litter.
3
4. N effects on decomposition rates of litter and humus
B. Berg, V. Meentemeyer, and M.-B. Johansson. Litter decompositon in a climatic transect of Norway spruce forests— climate and lignin control of mass-loss rates. In preparation.
To organize the information available we have subdivided the © 1997 NRC Canada
8
Environ. Rev. Vol. 5, 1997
Environ. Rev. Downloaded from www.nrcresearchpress.com by 150.254.164.85 on 04/19/11 For personal use only.
Table 4. Effect of varying concentrations of N in newly shed foliar litter on initial decomposition rates.
One species Scots pine Scots pine Scots pine Norway spruce Comparison of species Birch and pine Seven litter types Six litter types Four litter types Eight litter types
Interval in N concentration (mg⋅g-1)
Initial positive effect
4.0–8.1 4.0–8.1 4.0–12.0 4.2–18.3
+ + + –
P,S, water solubles P,S, water solubles — Water solubles
Berg and Staaf 1980 Berg et al. 1987 Berg et al. 1982 Berg and Tamm 1991a, 1991b
4.1–7.6 3.9–30.7 6 –12.0 4.5–15.2 5.2–13.1
+ + – + +
— P and water solubles Lignin:N — C:N, lignin:N, lignin, P
Berg and Wessen 1984 Berg and Ekbohm 1991 Taylor et al.1989 Edmonds 1980 Melillo et al. 1982
Alternative ratecontrolling agent
Ref.
Note: Comparisons were made both within a species and between species. In the former case, the differing levels were reached by fertilizing tree stands. The alternate rate-regulating agent refers to chemical components giving at least as good linear relationships as N concentration.
Fig. 7. Initial mass-loss rates of Scots pine needle litter as a function of concentrations of N (×), P (s), and S (n) (data from Berg et al. 1987). The strongest relation was obtained with P concentration.
4.1. A model, based on the natural variation in N, for systematizing the effects of N on decomposing litter and humus 4.1.1. General The decomposition of litter to humus can be divided into different stages. In this way we can distinguish between a succession of rate-regulating factors, which can help us to explain the sometimes shifting results obtained with different concentrations of N (and other nutrients) in litter and humus, and the effects of N additions. In earlier work the decomposition of litter was divided into two different functional phases, namely initial and later stages (cf. Berg and Staaf 1980). The recent literature also mentions final stages (cf. Howard and Howard 1974; Berg et al. 1995).
material and distinguished between different kinds of organic matter, as well as between different kinds of N additions and their effects. We have thus developed an existing model to distinguish between the different kinds of organic matter in soil (Fig. 5) as described in section 4.1. Different kinds of N additions to soil systems are shown (Fig. 6) and discussed in section 4.2. Finally, observations made in natural systems are compared with those made on systems receiving experimental N additions (sections 4.3–4.5), and effects that a change in the understory can have on decomposition are discussed (section 4.6). As indicated in Fig. 6, the information available does not cover all parts of the model.
4.1.2. Initial decomposition stages In their work, Berg and Staaf (1980) and Berg et al. (1987) distinguished temporal differences in decomposition behaviour. For the newly shed Scots pine litter, the decomposition rate was linearly related to concentrations of total N, P, and S until an accumulated mass loss of between 26 and 36% was reached (Fig. 7; Table 4). In a model (Fig. 5), they proposed an early decomposition phase in which solubles and nonlignified holocellulose were decomposed, and raised concentrations of N, among other elements, stimulated the process. This finding was confirmed by studies in which different litter types were combined (Berg et al. 1982; Berg and Ekbohm 1991). Newly shed litter of Norway spruce behaved differently, with decomposition in the early phase appearing to depend on concentrations of P and water-soluble substances rather than on the concentration of N (Table 4) (Berg and Tamm 1991a; cf. footnote 4). 4.1.3. Later stages of decomposition After the early stage, a negative relation was seen between lignin concentration and decomposition rate (Berg and Staaf 1980; Berg et al. 1987; McClaugherty and Berg 1987; Fig. 8). 4
W. Kratz, B. Berg, and F. Cotrufo. Increased atmospheric CO2 concentrations and litter quality. In preparation. © 1997 NRC Canada
9
Environ. Rev. Downloaded from www.nrcresearchpress.com by 150.254.164.85 on 04/19/11 For personal use only.
Berg and Matzner
This was supported by other work (e.g., Berg and Ekbohm 1991). In this later phase, factors influencing the decomposition of lignin also regulate the mass-loss rate of the litter. As litter decomposes, the concentration of the recalcitrant component lignin increases (cf. Berg et al. 1984). Once the litter has started to decompose, the lignin begins to incorporate N and undergoes other condensation reactions, marking the first step of humification (cf. Nömmik and Vahtras 1982). Such chemical transformations may result in structures that are not readily degraded by soil microorganisms. The increase in lignin concentration can be attributed to at least two phenomena. First, because these substances are highly resistant to decay, they decompose more slowly than more easily degradable substances, resulting in an increase in their concentration. Second, lignin-like compounds (and other forms of stabilized organic matter) are synthesized during the decay process. Many of the enzymes responsible for lignin degradation can, under appropriate conditions, catalyze the polymerization of lignin-like substances (e.g., Kondo et al. 1990; Lobarzewski et al. 1982). Furthermore, N-containing compounds can react with aromatic substances in the soil, yielding recalcitrant humic compounds (Nömmik and Vahtras 1982; Bollag et al. 1983; Liu et al. 1985). Other evidence for the production of recalcitrant organic matter comes from radiodated soils and chronosequencing studies. For example, 14 C dating has indicated that soil organic matter can be 1000 – 10 000 years old (Paul 1984; Stevenson 1982). The composition of the microbial community in general, as well as the composition of the lignin-degrading fungal flora, depends greatly on the properties of the litter input into a system. Thus, in addition to the degradability (“quality”) of the energy source, its nutrient content is important. Interactions between nutrients and organisms are, consequently, complex; for example, although a good supply of N may stimulate the initial microbial decomposition rate of litter, abundant N has been found to have the reverse effect at somewhat later stages. One example of such a reversal was given above; another is the finding by Keyser et al. (1978) that a white-rot fungus did not synthesize its lignin-degrading enzymes in the presence of low-molecular N-rich compounds such as ammonium and amino acids. The development of a fungal flora with such properties would naturally be hampered when growing on a highly decomposed, lignin-rich litter that is also rich in N. The fact that many species of white-rot fungi with this property have been found (P. Ander, personal communication) suggests that the inhibitory effect of high N levels on lignolytic enzyme production could be a widespread phenomenon. If so, it could be a general factor hampering lignin degradation, and thus litter decomposition, in several soil systems. The effect on microorganisms indexed by the concentration of total N (Fig. 5) may not depend on the concentration of total N per se but on the soluble N fraction. Such a view may also help us to understand the effect of added N. Manganese has been demonstrated by Perez and Jeffries (1992) to be essential for the activity of Mn peroxidase, a lignin-degrading enzyme. They also suggested that Mn promotes lignin decomposition by stabilizing the enzymes of the lignin-degrading system and by enhancing their production. Manganese is also involved in the regulation of other lignolytic enzymes, including laccase (Archibald and Roy 1992) and lignin peroxidase (Perez and Jeffries 1992).
Fig. 8. Relationship between mass-loss rates of Scots pine needle litter and lignin concentrations in litter (data from Berg et al. 1987). Late decomposition stages were used, in this case after the 1st year.
Calcium has been found to support the growth of a white-rot fungal species (Marasmius) (Lindeberg 1944), although the effect was pH dependent. This later decomposition phase may come earlier in a litter with a high lignin concentration, such as needles of lodgepole pine which initially may have as much as 40% lignin, whereas lignin regulation may start later for litters with an initially low concentration, for example, herbs and grasses. The lignin concentration will determine when litter N will have a rate-enhancing and -suppressing effect. The idea that the C:N ratio may regulate the rate of decomposition of organic matter dates back to 1916 when it apparently was introduced as a rule of thumb to evaluate the digestability of fresh cattle forage. In spite of the evident difference between this material and forest humus, numerous references supporting the use of the C:N ratio in this way are given by Waksman (1924), in a review by Harmsen and van Schreven (1955) and by Allison (1966). In his review, Fog (1988) presents well founded critical viewpoints on the indiscriminate use of the C:N ratio. 4.1.4. Final stages of decomposition With final stages we mean those at which the decomposition of litter appears to have stopped, leaving a certain recalcitrant fraction, variable in magnitude, that can be related to litter chemical composition (Howard and Howard 1974; Berg et al. 1996, 1995). Below we comment on the phenomenon and the influence of nutrients on the decomposing microflora. In their work Howard and Howard (1974) extrapolated © 1997 NRC Canada
10
Environ. Rev. Downloaded from www.nrcresearchpress.com by 150.254.164.85 on 04/19/11 For personal use only.
Fig. 9. A comparison between final decomposition values and initial concentrations of N (A) and Mn (B) in litter (modified from Berg et al. 1996).
measured litter decomposition values using an asymptotic function and calculated final values for litter decomposition. In another approach, Lousier and Parkinson (1976) estimated the low decomposition rate in the later and final stages. Howard and Howard (1974) estimated a set of final decomposition values, and later, Berg and Ekbohm (1991, 1993) repeated these results using very different litter types. Berg et al. (1995, 1996) organized these final values (limit values) into a system in which correlations existed between initial concentrations of both N and Mn and the limit values (Fig. 9). Initially high N levels in litter were thus negatively correlated with final decomposition values. Consequently, the higher the initial concentration of N, the higher the amount of residual N. Berg et al. (1996) also found a highly significant, positive relation (r = 0.757; n = 17; p < 0.001) between initial concentrations of Mn and limit values (Fig. 9). In a multiple regression, N, Mn, and Ca concentrations gave an r value of 0.888 (n = 17). Although the model deals with the decomposition of litter, the material would be considered to be humus, at least in the final phase according to most definitions (cf. Bal 1973). There are three possible explanations for the limit-value phenomenon: (i) the lack of soil-animal influence on decomposition (i.e., the exclusion of organisms that mechanically break down litter); (ii) the influence of nutrient composition on the community of microbial decomposers and the resulting effects on litter decomposition; and (iii) the absence of certain microorganisms required to achieve complete decomposition. Berg et al. (1995, 1996) systematized limit values for litters decomposing on natural, undisturbed soils. We may thus assume that under natural, undisturbed conditions and at least in certain temperate and boreal forest systems, the interaction mechanisms between organisms will not counteract a final decomposition value. On the other hand, it has been seen that in a disturbed system, for example, after soil scarification (Johansson 1994), the litter buried under the mixture of sand and humus decomposes beyond the estimated limit value. As the humus mineralizes and leaches, resulting in a rich input of nutrients to the litter, the competitive conditions and interactions in the microbial community apparently are changed so
Environ. Rev. Vol. 5, 1997 Fig. 10. A comparison between N concentration in humus (F and H layers) and CO2 release rate from the same samples incubated under standard temperature and moisture conditions. Samples were from a transect along Sweden (Bringmark and Bringmark 1991; L. Bringmark, personal communication).
much that decomposition can proceed further than the limitvalue estimate based on the undisturbed system. Fog (1988) described the interactions between different decomposing microbial species and how they can affect the rate and extent of the decomposition. Decomposition is very sensitive to such interactions, which can result in an enhancement of the process (Jacquin and Mangenot 1959; Saito 1966; Wicklow et al. 1980) or bring it to a complete standstill (Mangenot and Reymond 1963). A mechanism proposed by Berg et al. (1995), through which N can regulate humus layer buildup, cannot be concluded to be generally valid at this stage. For a validity limited to some ecosystems there is some clear long-term support, as there is good evidence for the formation of recalcitrant organic matter. Numerous chronosequencing studies support the idea that, in the absence of any disturbance, amounts of organic matter continue to increase in soils for centuries or even millenia (Jenny 1980). Further, 14C dating supports this (cf. above; Stevenson 1982; Paul 1984). Further support is the direct measurements made by Billet et al. (1990) who investigated 15 spruce sites and found an annual average increase in C in the soil organic matter of 353 kg⋅ha–1. Also Matzner (1989) measured, in a spruce stand, an increase in soil organic matter from 49 000 to 96 000 kg⋅ha–1 in a 16-year period. In a beech stand, the increase was from 29 000 to 48 000 kg⋅ha–1 in the same time period. 4.1.5. Humus Although we should be careful in generalizing with regard to the properties of humus, it appears that under undisturbed conditions that it is a relatively inert substance. As mentioned © 1997 NRC Canada
11
Environ. Rev. Downloaded from www.nrcresearchpress.com by 150.254.164.85 on 04/19/11 For personal use only.
Berg and Matzner
above, one kind of relative inertness may be due to a change in the composition of the microbial community resulting from a disturbance to the soil system (e.g., scarification). Respiration rates from humus samples have been found to be negatively correlated with the N concentration of the decomposing humus (Bringmark and Bringmark 1991; L. Bringmark, personal communication). Thus, respiration rates of humus samples collected in a transect over Sweden and kept under standard climatic conditions showed a significant negative relation to N concentrations in the humus (r = –0.650; n = 15; p < 0.01) (Fig. 10). Nitrogen concentrations were in the range of 1.0–1.9%. Such variation in N concentrations in humus could be a natural phenomenon (cf. Berg et al. 1997; section 5.1) rather than a pollution-related one. In another study in which humus was collected from across Europe, from the Arctic Circle to the Mediterranean, a highly significant, negative relationship between respiration and N concentration was found (R. Laskowski, personal communication). In a study carried out in northern Finland (Ohtonen and Markkola 1991) within a climatically and geographically limited region, a negative linear relationship was found between concentrations of total N and humus respiration (recalculated r = –0.635; n = 20; p < 0.01). The range in total N concentrations was similar to that reported by Bringmark and Bringmark (1991), namely, from 1.4 to 2.7%. Other factors that significantly influenced respiration rates were pHCaCl2 and moisture. Ohtonen and Markkola (1991) divided their sites into “cleaner” and “more polluted” groups. A comparison of the effect of the total N concentration in the cleaner part indicated that there may be a negative relation (r2 = 0.246; n = 10) to respiration, whereas the relation between respiration and ammonium concentration was positive (r2 = 0.501; n = 10; p < 0.05). 4.1.6. Humus and mycorrhiza In undisturbed soil systems there also appear to be mechanisms that will change the composition of the microflora in ways that enhance its ability to degrade the otherwise stable humus. Hintikka and Näykki (1967) gave a good description of the mycorrhizal basidiomycete Hednellum ferrugineum and its effects on the humus layer. The development of thick mycelial mats was described, as well as the strong outbursts of soil respiratory activity, followed by a strong decrease in the amount of humus in the combined A01 and A02 horizons (F + H horizons). The effect was observed on dry, sandy, nutrient-poor sediment and till soils and could be related to plant growth. It appears to be a powerful mechanism driving humus decomposition. Unestam (1991) discussed this effect for certain other mycorrhizal fungi. Further, Griffiths et al. (1990) studied the effects of the ectomycorrhizal fungus Hysterangium setchelli on respiration in humus under Douglas-fir (Pseudotsuga menziesii) and identified patches with very high respiratory activity. There appears to be a consensus among authors that the decomposition of humus material by ectomycorrhizal fungi provides an important source of nutrients for trees. 4.2. A distinction between direct and indirect inflows of N There are two kinds of N inflows to the soil systems. Direct inflows occur in the form of atmospheric deposition or by fertilization in the laboratory or field. Indirect inflows are also long term, being caused by the gradual increased amount of N
through deposition, which has been taken up by the plants and caused an increase in N concentrations in the plants and thus in the litter. These indirect additions thus occur via plants and can be compared with observations in N-rich natural systems (cf. Fig. 6; section 4.5). 4.2.1. Direct inflows With annual N deposition values of, say, 10 and 100 kg⋅ha–1, the daily input of N would be on the order of 2.8 and 28 mg⋅m–2. With such daily inputs, the effect of deposition would not be readily apparent in the soil system; however, in the long run the plant community would change, both in nutrient contents (section 2.3) and in structure (section 4.6). Effects on microbial activity would be difficult to assess on a short-term basis, and any observable effects would probably be long-term ones. They would then be combined with indirect effects (section 4.5) owing to a change in litter quality and (or) a change in the understory. Direct additions can also be experimental, for example, in the laboratory or as fertilizer applications in field plots. 4.2.2. Indirect inflows Inflows of nutrients to soil gradually alter the properties of the plant material as substrate for decomposers (section 2.3). This is considered as an indirect effect, since the added N is converted into the system’s own “natural” components. Of course, such a balanced increase in different nutrients would end as soon as any vital nutrient becomes limiting in the system or a change occurs in the system owing to N levels becoming too high. Another effect of the deposition/fertilization can be a change in microclimatic conditions on the ground owing to the higher growth rate of both the trees and ground vegetation. A good example could be a spruce forest which grows faster in response to an external N input and thus develops a closed, dense canopy at an earlier age. This canopy has a profound effect on the microclimate through interception of both deposition and solar radiation. Another kind of effect is seen in more open forests in which a changed, and often richer, understory will develop that will alter the microclimate in the forest floor. The turnover of a nutrient-rich herbal layer may influence the nutritional status of the organic layer (Tamm 1991). Deposition will probably also change the microbial composition of the litter and the course of microbial succession in the organic layer (cf. below). We can thus distinguish between at least three kinds of effects, namely, the effect of direct addition of N and two indirect effects caused by the long-term deposition of N, referred to here as “changed substrate quality” and “changed forest floor” effects. 4.3. Direct effects of added N 4.3.1. Chemical effects Under suitable pH conditions, chemical reactions will take place in which both ammonium and nitrate react with lignin remains and phenolic components. One probable effect of these reactions is to increase the litter’s resistance to decomposition. This reaction (above) takes place in several steps, starting with the adsorption of low-molecular N compounds which are then incorporated into covalent bonds such as quinones (Nömmik © 1997 NRC Canada
12
Environ. Rev. Vol. 5, 1997 Table 5. The effect of additions of ammonium nitrate on initial decomposition rate of decomposing foliar litter. Litter type
Type of effect
Sparangium eucarpum leaves Sitka spruce needle litter
Increase Increase
Sign
Ref.
p<0.001
Hohmann and Neely 1993 Adams and Cornforth 1973
Environ. Rev. Downloaded from www.nrcresearchpress.com by 150.254.164.85 on 04/19/11 For personal use only.
Note: The studies were performed in the laboratory.
and Vahtras 1982; Stevenson 1982). In a laboratory study by Axelsson and Berg (1988) using [15N]ammonium, it was found that this reaction was limited by the concentration of N, determined as irreversible adsorption. These findings suggest that under field conditions this reaction could be accelerated by an increase in ammonium levels and it may be considered in systems with raised ammonium levels in the humus. It has been suggested that the kinds of products resulting from this fixation reaction tend to retard decomposition (Nömmik and Vahtras 1982). Such an effect would not necessarily be caused by poisonous products, but could very well result from the numerous reaction products, leading to the formation of highly polymerized, recalcitrant products giving chemical barriers. Such products could be formed from partial decomposition products of lignin, and there are a multitude of possible recombination products that can be created using N compounds as links. In view of the high number of possible recombination products, it seems unlikely that there are biological degradation mechanisms for all of them. A similar type of chemical fixation probably takes place in undisturbed systems (section 4.1), the difference being that the process is speeded up by N deposition.
samples from polluted and nonpolluted plots in northern Finland. They found a significant difference in respiration between the two sets of plots. When using data from the polluted plot, they found a negative relation between soil respiration and ammonium level when varying NH4 between 15 and 177 µg NH 4⋅g–1. In the 10 less-polluted plots, respiration was positively related to the ammonium concentration, which was in the range of 10–21 µg⋅g–1 organic matter. In the former plots, the ammonium concentration corresponds to values measured by Söderström et al. (1983) for control plots in central Sweden.
4.3.2. Biological effects on newly shed litter Only a few studies have dealt with the early stages of litter decomposition. In one, where leaves of Sporangium eurocarpum and the needle litter of Sitka spruce were subject to additions of ammonium nitrate, decomposition rates were enhanced in both cases (Table 5).
samples taken from a long-term fertilization experiment (cf. Tamm 1991) had a lower activity compared with the con-
4.3.3. Biological effects on humus Experimental addition of N compounds to soil to simulate deposition may directly affect the soil microflora in a variety of ways and just the high concentrations of ammonium, for example, may create different effects. Effects on C mineralization can seem confusing (cf. Fog 1988) depending on the form of N added (urea, ammonium nitrate, etc.) and on the type of substrate to which it is added (below). Fog (1988) concluded that the source of the added N is not of major importance, since rate-repressing effects had been obtained with urea, ammonium salts, and nitrate salts. Some investigators also tried both inorganic and organic N sources (Findlay 1934; Barder and Crawford 1981; Reid 1983). Fog’s general conclusion seems to be that rate-enhancing effects occur most often with complex organic-N sources, which could reflect a vitamin effect or an effect of the C source, rather than an N effect. In the recent literature there is very little on the effect of N additions on microbial activity in humus. To try to distinguish between different types of effects, we have treated deposition and different kinds of additions under separate headings, namely, ammonium and urea. 4.3.3.1. Directly measured effects of N deposition: Ohtonen and Markkola (1991) compared microbial respiration in humus
4.3.3.2. Additions of ammonium and nitrate salts: In all cases we found in the literature there was a decrease in activity following the addition of ammonium salts to humus (Table 6). Below we have listed recent studies according to tree species. Some studies on agricultural soils indicate that nitrate salts can also retard humus decomposition (Table 7). Most investigations have been carried out on humus from Scots pine stands. Persson and Wiren (1989) found that the addition of ammonium nitrate to humus suppressed CO2 evolution within only a few days. They also found that humus trol. In that experiment annual doses of ammonium nitrate (80 kg⋅ha–1) had been applied for ca. 16 years. Söderström et al. (1983) investigated the effect of adding ammonium nitrate on CO2 evolution from humus samples. The treatment caused an almost immediate suppression of CO2 production, and in several cases the effect appeared to increase with time. Under field conditions levels of ammonium remained elevated for up to 3 years following N fertilization. Further, for up to 5 years after the last fertilization they observed microbial suppression on N-fertilized plots. Significant decreases were found in respiration, as well as in numbers of fluorescein diacetate (FDA) active bacteria and length of fungal hyphae. In a set of plots given different N doses, activity decreased as the dose was increased (Nohrstedt et al. 1989). The effect was investigated and very clear in four layers of soil organic matter. Bååth et al. (1981) measured the effect of N additions on respiration and FDA mycelium and found clear decreases in activity and amount, respectively. Using a humus from a jack pine forest, Foster et al. (1980) also noted a decrease in soil respiration after adding ammonium nitrate. In this case as well, the effect increased with time. In another study using humus from jack pine, Fessenden et al. (1971) found no decrease in activity up to 8 days after amendment with ammonium nitrate. Humus samples from six Norway spruce stands were investigated (Söderström et al. 1983) by adding ammonium nitrate and measuring CO2 evolution. In all cases they noted suppression from the start of the experiment, and in several cases the effect increased with time. Raised ammonium levels in the soil © 1997 NRC Canada
13
Berg and Matzner Table 6. Effect on microbial activity of additions of ammonium salts (mainly ammonium nitrate) to humus samples. Effect Origin of humus
Dosage
Immediate
Activity measure
Delayed
Field/Laboratory
Ref.
Pine forests Jack pine
200 kg⋅ha-1
Scots pine
2 mg⋅g-1 4 mg⋅g-1 80 kg⋅ha-1 150–600 kg⋅ha-1
Environ. Rev. Downloaded from www.nrcresearchpress.com by 150.254.164.85 on 04/19/11 For personal use only.
Scots pinea
Scots pine (A00,A01,A02,A1b) 150 –600 kg⋅ha-1 Scots pine and Norway spruce 2 mg⋅g-1
Decrease None(?) Decrease Decrease ND ND ND ND
ND ND ND Decrease Decrease Decrease Decrease Decrease
Decrease
ND
O2 CO2 CO2 CO2 CO2 CO2 FDA-mycelium CO2
Laboratory Laboratory Laboratory Laboratory Field Field/laboratory Field/laboratory Field/laboratory
Foster et al. 1980 Fessenden et al.1971 Söderström et al. 1983 Persson and Wiren 1989 Persson and Wiren 1989 Bååth et al. 1981 Bååth et al. Nohrstedt et al. 1989
CO2
Laboratory
Söderström et al. 1983
CO2 CO2 CO2 CO2 CO2
Laboratory Laboratory Laboratory Laboratory Laboratory
Roberge 1976 Roberge 1976 Roberge 1976 Söderström et al. 1983 Smolander et al. 1974
CO2
Laboratory
Söderström et al. 1983
CO2
Laboratory
Attiwill and Maheswaran 1989
Field Field
Söderström et al. 1983 Söderström et al. 1983
Laboratory
Maas and Adamson 1972
Spruce forests Black spruce L horizonc F1 horizon F2 horizon Norway spruce Norway spruce
2.2 mg⋅g-1 2.2 mg⋅g-1 2.2 mg⋅g-1 2 mg⋅g-1 950 kg⋅ha-1d
Decrease Decrease Decrease Decrease ND
ND ND ND ND Decrease
Common beech forests -1
Common beech
2 mg⋅g
Decrease
ND Eucalypt forest
Eucalypt
10–50 ppm
Decrease
ND Other sources
e
Different species
1.2 mg⋅g-1
Peat
ND
Decrease
ND
Decrease
CO2 Microbial biomass Mass loss
Note: Increased activity is indicated by increase and decreased activity by decrease. Immediate effect refers to effects observed within days or weeks, while delayed effect refers to those observed after months or years. a The forest floor (including the humus) was fertilized for the last time 6 years prior to measurement. b The separated humus horizons. c The separated humus horizons. d Additions were made for 16 years and the forest floor (including the humus) was fertilized for the last time 2–5 years prior to measurement. e The forest floor (including humus) from several plots fertilized between 3 months and 5 years prior to measurement.
Table 7. Some comparisons of the effects on microbial activity of additions of nitrate and ammonium salts to agricultural soil samples. Type of N Ammonium nitrate Ammonium sulfate Potassium nitrate Potassium nitrate
Level of rate decrease
Method of measurement
Ref.
CO2 release CO2 release CO2 release CO2 release
Blagodatskiy et al. 1993 Blagodatskiy et al. 1993 Blagodatskiy et al. 1993 Green et al. 1995
Strong Strong Low but significant Significant
Note: Measurements were short term and made in the laboratory.
prevailed for up to 3 years after fertilization. Further, microbial activity was suppressed on N-fertilized plots for up to 5 years after the last fertilization when ammonium levels were similar to those of the controls. Respiration, as well as numbers of FDA-active bacteria and fungal hyphae, showed a significant decrease. In different forest-floor layers of black spruce, Roberge
(1976) found a clear decrease in soil respiration after adding ammonium nitrate or ammonium sulphate. The effect lasted from the day of addition to the end of the incubation. Humus samples were investigated in common beech by Söderström et al. (1983) by adding ammonium nitrate and measuring CO2 evolution. The treatment suppressed CO2 production throughout the experiment. © 1997 NRC Canada
14
Environ. Rev. Downloaded from www.nrcresearchpress.com by 150.254.164.85 on 04/19/11 For personal use only.
Maas and Adamson (1972) added N to a peat and then monitored mass loss. There was a decrease in mass loss rate in all three cases, but it was only significant in two of them. The authors did not mention the form in which the N was applied. We can conclude from this section that ammonium nitrate has a pronounced suppressive effect on biological activity in the humus. 4.3.3.3. Urea additions: Nitrogen deposition does not take place in the form of urea, but rather as ammonium and nitrate. However, urea has often been used for experiments in the field, since it is commonly used as a fertilizer. Since it has a much more profound effect on the soil organic matter than either ammonium or nitrate, urea should be commented upon separately. In all but one case found in the literature, urea appeared to stimulate soil biological activity; for example, it enhanced respiration and increased bacterial numbers and fungal biomass. Since urea added to soil is normally subjected to rapid enzymatic hydrolysis (by urease), there generally is a vigorous evolution of both CO2 and NH3, and thus a strong increase in pH. Its addition also leads to the solubilization of C compounds which will stimulate soil microbial activity (Foster et al. 1980). Good comparisons have been made between the effects of ammonium nitrate and those of urea, including their ability to enhance the solubilization of C compounds (Foster et al. 1980). Further support to these effects of urea have been made by Salonius (1972) and Roberge and Knowles (1966). Fog (1988) also discusses these effects. The one case where urea addition reportedly reduced soil microbial activity was a field experiment in which the urea had been added 6 years prior to the investigation (Nohrstedt et al. 1989). In several of the reviewed studies, unlabelled urea was added to the soil and the subsequent CO2 release measured. With this method the stimulating effects of the urea could have been hidden, leading to confusion among the readers. Nevertheless, the activity-enhancing effects of urea seem to be well established. 4.3.4. Biological effects on humus—mycorrhiza Nitrogen fertilization has been observed to decrease both total numbers of mycorrhizal basidiomycetes and number of species (B. Berg, unpublished). It has also been shown that N additions strongly reduce the frequency of mycorrhiza. Thus, in his comprehensive review, Kuyper (1989) cited cases where N fertilization and N deposition had strongly decreased the numbers of fruit bodies and the frequency of ectomycorrhizal species in the most common forest types of northern Europe. Some studies (Ruehling and Tyler 1991; Brandrud 1995) indicate that the numbers of fruiting bodies of ectomycorrhizal species decrease after N additions. From two studies we may conclude that N additions may reduce both the frequency of fruiting bodies and the frequency of ectomycorrhizal root tips, but the latter were not affected a few years after the last addition (Tremorshuizen 1993; Arnebrant and Söderström 1992). For oaks, Beckjord et al. (1985) showed that there was a suppression of ectomycorrhizal root-tip formation at higher dosages of N. We have not come across any studies on the effect of N additions on mat formation by ectomycorrhizal mycelium or on fast-decomposing humus layers. However, it appears reasonable
Environ. Rev. Vol. 5, 1997
to assume that, since N additions have a generally suppressive effect on mycorrhizal fungi, such effects would include the described mat formation and rapid decomposition of humus. An increase in the deposition-related increase in N supply should, therefore, suppress a mechanism intended to supply the trees with nutrients (e.g., N). Kuyper and de Vries (1990) reported that there was a slight correlation between a decline of both ectomycorrhizal species and decomposer fungi on one hand and an increase in the litter layer on the other. However, our conclusion will be that this is a research field that may deserve attention. 4.4. Indirect effects on the decomposition of litter and humus caused by a change in substrate quality 4.4.1. Early decomposition stages of plant litter Most litter decomposition studies present data from the early stages of decomposition, and normally one can find positive correlations between the concentration of N and litter mass loss or CO2 evolution. Unless the ash concentration is high, the concentration of C in the litter will remain relatively constant (around 50%) and the C:N ratio for the newly shed litter will also give good relationships in this early stage. Even though N appears to be one of several dominant rateregulating factors in the newly shed litter, the concept of newly shed litter is not a simple nor a singular one. The degradation dynamics of several deciduous and coniferous litters may follow the model presented in Fig. 5 (e.g., needles of different pine species; leaves of birch, willow, aspen and alder; root litter and possibly also grass and herbs litter). It is even possible that the model may have relatively general validity. However, litter from spruce may behave differently (below). In plant litter, concentrations of several nutrients are often correlated, and decomposition requires balanced proportions of nutrients necessary for microbial growth (e.g., for N, P, and S). Their concentrations may thus provide an index of substrate quality and decomposition rate, provided that the C source is not limiting, which normally means that it is of a nonlignin character and not sequestered in lignin. Thus Berg et al. (1987) found a better correlation between initial rate and P concentration than between initial rate and N concentrations. In a comparative study on substrate quality, B. Berg (unpublished) did not find any correlation between initial mass-loss rates and N concentration, whereas concentrations of P and water solubles showed highly significant correlations. Further, Johansson et al. (1995) reported an imbalance between concentrations of N and P based on 1 year of consecutive samplings of Scots pine needle. Thus, the litter with an N concentration of 1.04% N did not decompose any faster than litter with 0.4% N. In both cases the P levels were similar and may have been regulating. The initial decomposition rate can normally be related to concentrations of N, P, and S, and to our knowledge no other nutrient has been seen to have a rate-regulating effect at the early stages, at least for temperate and boreal forest systems. Of course, this does not necessarily mean that no such cases exist. We can thus not exclude that a higher N concentration may result in a higher decomposition rate. Later years work on Norway spruce needle litter (Berg and Tamm 1991a,1991b; footnote 3) has revealed an alternative view on the concept of newly shed needle litter. This litter type appears to have a highly varying chemical composition and © 1997 NRC Canada
Berg and Matzner
Environ. Rev. Downloaded from www.nrcresearchpress.com by 150.254.164.85 on 04/19/11 For personal use only.
falls in a less predictable way compared with, for example, that of pine needle litter. Although it is possible to find good correlations between concentrations of P or water-soluble substances and initial mass-loss rate, there is a no relation between this rate and N concentrations. One reason for this could be that newly shed litter is in variable or late stages of decomposition and thus lignin regulated. Dead spruce needles may remain attached to the branches for some time before they fall, which means that they could undergo partial decomposition on the branches. 4.4.2. Later stages of plant litter decomposition As litter decomposes, the concentration of the recalcitrant component lignin increases. In the later decomposition phase, the degradation of lignin thus regulates litter mass-loss rates (Berg and Staaf 1980; Berg et al. 1987). Degradation rates of lignin and its modified forms may be influenced in two ways: a biological one and a chemical one. Although we can set a limit between the early and later stages, there does not appear to be any very clear limit between the later phase and the final one. However, in this paper we have set an upper limit at which lignin-based regulation appears to cease. This limit is often at about 50% lignin, at which point its concentration tends to remain constant (Fig. 5) (cf. Berg et al. 1997). 4.4.2.1. Biological regulation: The decomposing activity in litter and humus can be regulated through signals to the soil microflora by the availability of important nutrients. Thus high N levels can suppress the lignin-degradation rate (cf. Keyser et al. 1978) and, consequently, litter decomposition rates (Berg et al. 1987). High levels of Ca and Mn apparently can increase the rate (Lindeberg 1944; Eriksson et al. 1990). There seems to be a common, although incorrect, opinion that N has a generally rate-stimulating effect on microbial processes (Alexander 1977). The opposite situation, namely that N may retard rate of organic matter decomposition, has yet to be fully recognized. Early observations were made by Hungate (1940), among others, who found that a good supply of N did not generally promote the decomposition of wood. However, it was not until 1978 that Keyser et al. (1978) clearly demonstrated the negative effect that N can have on the production of lignin-degrading enzymes by a white-rot fungus. Since then, several scientists have questioned the general ability of the C:N ratio to predict C mineralization in litter/soil systems. Herman et al. (1977) and Berg and McClaugherty (1987) noted that N in dead plant material had various effects on the decomposition of carbohydrates and lignin. They proposed that decomposition could be better predicted by a combination of the C:N ratio (or N concentration) and the lignin:carbohydrate ratio than by the C:N ratio alone. Berg (1986) concluded that the decomposition of the main part of the forest litter is regulated by the rate of lignin decomposition and that this rate, in its turn, is increased by a high cellulose content and decreased by a high N content. In his review, Fog (1988) concluded that these regulation mechanisms are also generally valid for nonforest litters. The concentration increase in lignin and lignin-like substances during decomposition (Berg et al. 1997; Berg et al. 1982) can be attributed to at least two phenomena. First, because lignins in many soil systems are highly resistant to decay, they decompose more slowly than more easily degradable
15
substances, resulting in an increase in their concentration. Second, lignin-like compounds (and other forms of stabilized organic matter) are synthesized during the decay process. Many of the enzymes responsible for lignin degradation can, under apropriate conditions, catalyze the polymerization of ligninlike substances (e.g., Kondo et al. 1990; Lobarzewski et al. 1982). The number of microorganisms producing enzymes degrading lignin and lignin-like products is relatively low. Although much remains to be learned about the ecology of these organisms, some knowledge of the white-rot fungi may be useful. These fungi are able to degrade lignin completely, in contrast to brown-rot organisms which can only cause limited degradation. The composition of the microbial community in general, as well as that of the lignin-degrading fungal flora, depends greatly on the properties of the litter entering the system. Thus not only the degradability (“quality”) of the energy source but also its contents of various nutrients are important. A low concentration of nutrients may, of course, limit the activity, but nutrients may also act as a selection mechanism for species. The observation by Keyser et al. (1978) that a white-rot fungus did not synthesize its lignin-degrading enzyme system in the presence of low-molecular-weight N compounds has been confirmed for several species (Eriksson et al. 1990). The development of fungi with such properties would naturally be hampered on a highly decomposed, lignin-rich litter that is also rich in N. The fact that many species of white-rot fungi with this property have been found (P. Ander, personal communication) suggests that this effect could be a widespread phenomenon. It would thus be a more general factor hampering lignin degradation and, consequently, also litter decomposition in several soil systems. However, there are species of white-rot fungi that are not sensitive to high levels of N (P. Ander, personal communication), and soil/litter systems in which they dominate remain to be discovered. 4.4.2.2. Chemical mechanisms: Once the litter has started to decompose, the lignin begins to incorporate N and undergoes condensation reactions, marking the first step of humification (cf. Nömmik and Vahtras 1982). (cf. discussion in section 4.1.3.). 4.4.3. Final stages of litter decomposition and humus It appears that no information exists on the final stages of litter decomposition and we may compare with the information in humus with naturally variable N levels (cf. section 4.1). 4.5. Direct versus indirect effects—two suppression mechanisms? Based on the studies discussed in sections 4.3 and 4.4 we can construct a hypothesis. The suppression of CO2 release from different kinds of humus could be correlated with concentrations of total N (Fig. 10) and related to additions of mainly ammonium salts (Table 6). We can make a distinction between these two cases. A high level of total N in humus does not necessarily mean that levels of ammonium are high as well. In their study, Bååth et al. (1981) found a decrease in respiratory activity ca. 5 years after N additions had taken place, so that in the fertilized plot ammonium levels had decreased to the levels measured in the control plot (Söderström et al. 1983). Although © 1997 NRC Canada
16
Environ. Rev. Vol. 5, 1997 Table 8. Summary of the effects that raised ammonium levels and increasing total N concentrations have on respiration. Type of N Addition/system Addition, short-term (<1/2 year) Addition, long-term (>1 year) Natural systems
a
Raised NH4 levels
Raised total N
– – No inform
No inform – –
Environ. Rev. Downloaded from www.nrcresearchpress.com by 150.254.164.85 on 04/19/11 For personal use only.
Note: A minus sign indicates decreased activity. Data are presented in sections 4.3 and 4.4 and data are taken from Table 6. a Effects often evident after only 2–3 days.
they did not realize it, further conclusions can be drawn from their data by considering these results together with those of Bringmark and Bringmark (1991) and Laskowski et al.5 (cf. Fig. 10). The former measured the effect of total N on humus respiration with N concentrations in the range of 1.0–1.9% and found a significant decrease with increasing N concentrations. Also Laskowski et al.5, measuring humus respiration, found a highly significant negative relationship between N concentration and respiration rate. It thus appears that in these cases there was a clear suppression related to levels of total N. Considering the immediate effect of ammonium additions, we can forward the hypothesis that there are two active submechanisms for the suppression of microbial decomposition/ respiratory activity. This hypothesis is supported by two earlier studies (Table 8), although the evidence is not conclusive. (i) High total N effect. In their review Nömmik and Vahtras (1982) described the chemical reaction between phenolics and low-molecular N, ultimately leading to new covalent bonds with N bridges between molecules. Such new chemically formed compounds might be partially or totally resistant to degradation by microbial enzymes. They could thus form a chemical barrier that would lead to a lower level of decomposition activity and less CO2 release. This effect agrees with those caused by high levels of total N. (ii) High ammonium effect. High levels of ammonium or nitrate in lignin-degrading fungi (Keyser et al. 1978) have been found to suppress lignin degradation in a large number of fungal species (P. Ander, personal communication; Eriksson et al. 1990). It is reasonable to conclude that raised ammonium levels in the soil will suppress the lignin-degrading microflora and thus retard lignin-degrading activity. Such a physiological effect may take place within a time span of hours or days. The suppressing effects that have been ascribed to high concentrations of total N and ammonium appeared to influence the lignin-degrading microflora. However, in no case has the measured suppression been total, meaning that CO2releasing microbial activity has been reduced but never totally suppressed. We cannot exclude the possibility that a certain fraction of the soil organic matter is stimulated by a N addition. Thus, the actually measured CO2 release is a net effect of lignin degradation being suppressed while the degradation of carbohydrates and soluble C compounds in the humus is 5
R. Laskowski, M. Niklinska, M. Maryanski, and B. Berg. Respiration and nitrogen mineralization rates in soils of Scots pine forests as related to chemical composition and climatic conditions.Long-term decomposition in a Scots pine forest. XII. In preparation.
stimulated. Thus, if the main part of the material is lignified or sequestered by lignin-like compounds, the suppression of this part must be stronger than that indicated by the total decrease in CO 2 release, and we cannot exclude the possibility that a heavy addition of soluble N compounds (e.g., ammonium) will strongly repress the microbial lignolytic system and reduce the decomposition/mineralization of the lignified and lignin-like humus parts to close to zero. The measured CO2 may then come from less recalcitrant parts of the humus or be produced by white-rot fungi that are not sensitive to raised ammonium levels. Results of some studies support this scenario. For example, Green et al. (1995) showed that nitrate additions clearly suppressed respiration from humus in soil. With the addition of fresh litter (corn stover) to the same soil, which then contained both humus and fresh plant material, the nitrate added had a rate-stimulating effect, which could be ascribed to the addition of a fresh C source. This may also explain the observation of Gallardo and Schlesinger (1994) that addition of ammonium nitrate to a forest floor with both humus and litter had a rate-stimulating effect. 4.6. Effects resulting from changes in the forest floor Long-term periods of deposition and (or) high additions of N to a nutrient-poor forest soil may change the system completely in terms of both ground vegetation and tree growth. By contrast, less pronounced effects would be expected in a forest on a nutrient-rich soil that already has a dense canopy and well-developed understory. Much of the evidence that N affects the ground vegetation has been obtained from either fertilization experiments or by comparing accurate site descriptions from the past with those from the present. We will first comment on the changes as such; thereafter, their effects on decomposition are discussed. 4.6.1. Experimental N additions Long-term (about 10 years) additions of N have changed the ground vegetation completely in open Scots pine forests (Tamm 1991; Bobbink et al. 1992). The effect on this kind of open and nutrient-poor forest, with a sparse ground vegetation of heather, lichens, and cowberry, was considerable, and annual additions of 120 kg N⋅ ha–1⋅ year–1 created a thick layer of grass and herbs. Heavy doses of fertilizer may kill the original vegetation and temporarily leave the ground bare. However, this would not occur in connection with the low amounts of N supplied as low daily doses in the form of atmospheric deposition, thus not creating this experimental error. In one such fertilization experiment, a 30-year-old Scots © 1997 NRC Canada
17
Berg and Matzner Table 9. The effect of additions of ammonium nitrate on the decomposition rate of decomposing foliar litter. System/litter type
Type of effect
Sign
No. of incubations
Ref.
Berg and Tamm 1991a, 1991b Berg and Tamm 1991a, 1991b Berg and Tamm 1991a, 1991b
Early stages
Environ. Rev. Downloaded from www.nrcresearchpress.com by 150.254.164.85 on 04/19/11 For personal use only.
Norway spruce system Scots pine needles Norways spruce needle litter Green Norway spruce needles Scots pine system Scots pine needle litter Scots pine needle litter
Rate decrease No difference No difference
p<0.001
14 8 2
Rate increase Increase/no differencea
p<0.001
6 6
Berg et al. 1991 Berg et al. 1991
Note: The litter was incubated in experimental plots that had undergone changes in vegetation following long-term additions of N. a Difference among years.
pine forest in central Sweden (cf. Tamm et al. 1974) received annual doses of 20, 40, and 60 kg N⋅ha–1⋅ year–1 as ammonium nitrate. The ground vegetation at the start of the experiment consisted of Calluna vulgaris, Vaccinium vitis-idaea, Vaccinium myrtillus, Cladonia spp., and some mosses such as Dicranum spp., Pleurozium spp., and Hylocomium spp. The first changes became apparent after 8–15 years. After ca. 20 years, the original species had disappeared in plots supplied with 40 and 60 kg N⋅ha–1⋅year–1. These species were replaced by Epilobium angustifolium, Rubus idaeus, Deschampsia flexuosa, Dryopteris carthusiana, and the moss Brachythecium oedipodium (Dirkse et al. 1991). Another type of effect was seen in a heavily fertilized stand of Norway spruce (Tamm et al. 1984), in which the trees responded well to fertilizer, grew considerably faster, and closed their canopies so well that the earlier ground vegetation of moss, grass and herbs completely disappeared, leaving a forest floor denuded of vegetation but with a good cover of litter. Effects of applying ammonium nitrate (60 –180 kg N⋅ha–1⋅year–1) for 5 years in stands of common beech (Fagus sylvatica) were reported by Tyler et al. (1992). They observed a strong decrease in the biomass of ground vegetation following the applications of N and the frequency of most herb-layer species declined significantly. 4.6.2. Observations following ambient N deposition The vegetation of a central Dutch forest was characterized in 1981 and compared with an earlier (1958) description of the same forest. It was estimated that this site has an N deposition ranging from ca. 20 to 40 kg N⋅ha–1⋅year–1. By 1981, all lichens had disappeared and a strong increase was seen in the frequencies of Deschampsia flexuosa and Corydalis claviculata (Dirkse and Van Dobben 1989). An investigation covering ca. 90% of the Dutch forests showed that in the 1980s among the 40 most common forest plants found were Galeopsis tetrahit, Stellaria media, Deschampsia flexuosa, Molinia caerulea, Agrostis capillaris, and Poa trivialis (Dirkse and Van Dobben 1989). The high abundances of these species can apparently be attributed to N deposition. Two compatible stands of Quercus robur in two areas differing in N deposition, i.e., 6–8 and 12–15 kg N⋅ha–1⋅year–1, respectively, were investigated with emphasis on N indicator species (Tyler 1987). In the more polluted stand, there were markedly higher frequencies of Urtica dioica, Epilobium angustifolium, Rubus ideaus, Stellaria media, Galium aparine, Aegopodium podagraria, and Sambucus spp.
Other observations were made by Falkengren-Grerup (1986) and Falkengren-Grerup and Eriksson (1990), who examined the changes in soil and vegetation in south Swedish stands of common beech and oak. Marked increases were found for Lactuca muralis, Dryopteris filix-mas, Epilobium angustifolium, Rubus idaeus, Melica uniflora, Aegopodium podagraria, Stellaria holostea, and Stellaria nemorum, some of which are N indicators. They concluded that the most reasonable explanation for these increases was the increased N deposition, which was approximately 15–20 kg N⋅ha–1⋅year–1 in southern Sweden. In a regional study in Sweden, Rosen et al. (1992) found a significant positive correlation between N deposition and the increase in Deschampsia flexuosa cover over the last 20 years. 4.6.3. Effects observed on litter decomposition 4.6.3.1. Early stages: As an understory changes, so does the microclimate to which litter is exposed, which will affect its decomposition rate. For Scots pine needles, the decomposition rate was clearly higher (Table 9) for newly shed litter in a heavily N-fertilized plot that had undergone strong vegetation changes, the 1st year mass loss being 30.4% as compared with the control plot (26.3%). This plot had been fertilized with 80 kg N⋅ha–1⋅year–1 for 16 years and the fertilizer had created a richer ground vegetation. The canopy cover in this 20-year-old forest was closed, whereas the canopy cover in the control forest was still open. During certain years, decomposition was up to 35% higher in the fertilized plots. The same types of response were observed in another Scots pine forest (B. Berg, unpublished) and may indicate that the microclimate in the forest floor had changed, but it is very likely that changes in nutrient supply and in the microflora also contributed to the effect. In a Norway spruce forest, the response was the opposite to that described above. After 15 years the canopy cover in the control plot was still open; thus, compared with the fertilized plot, temperatures were higher, more rainfall reached the ground, and interception was very low. These conditions were conducive to the development of a ground vegetation of grass and some herbs. The fertilized plot, on the other hand, had a completely closed canopy cover that did not allow any ground vegetation to develop. A chemically identical Scots pine needle litter incubated in parallel in the two types of stands decomposed more slowly in the fertilized stand (Table 9). By contrast, for decomposing spruce needles no difference was © 1997 NRC Canada
18
Environ. Rev. Vol. 5, 1997
Environ. Rev. Downloaded from www.nrcresearchpress.com by 150.254.164.85 on 04/19/11 For personal use only.
Fig. 11. Relationship between N-concentration increase rate (NCIR) in needle litter and the climate index actual evapotranspiration (AET) in a climatic transect ranging from the Arctic Circle to the northern part of the European continent (from Berg et al. 1997). ×, Scots pine; *, lodgepole pine and White pine; j, Norway spruce. R2adj is used according to Ekbohm and Rydin (1990).
seen, possibly because one or more factors related to substrate quality were more limiting than the climate. In the case of Scots pine needles, the difference in decomposition between plots probably reflects the difference in climate. 4.6.3.2. Late stages: In the later stages of decomposition, the altered microclimate could lead to changes in decomposition pattern. Thus, for example, Berg et al. (1991) and B. Berg (unpublished) found that in a N-fertilized and a control plot, decomposition rates converged from rates that had initially been quite different. 4.6.3.3. Final decomposition stages and humus: Apparently no studies have been made to determine how N addition affects final decomposition values. Several factors may influence final-stage values, and for tree litter they will probably change in response to N deposition, although it is difficult to predict in what direction. A combined effect may cause a less fargoing decomposition, though as judged from the effect of N on humus respiration and on final limit values (cf. above).
5. Fate of the added nitrogen 5.1. Natural systems When plant litter decomposes, N concentrations may increase to between two and four times the initial concentration, with decreases in concentration only observed on a few occasions (e.g., Berg and Cortina 1995). Normally when the N dynamics of litter and humus are described, only the net changes are presented; however, the actual flows of N may be more complicated. Thus, at the same time as needle litter is taking up N, it is releasing N already present in the litter (Berg and Staaf 1981; Berg 1988). Although the dynamics of N may be complex, the increase
in concentration to accumulated litter mass loss is often described as a straight line relation (Berg and Staaf 1980, 1981). This linear relationship appears to apply generally (cf. Berg and McClaugherty 1989; Berg et al. 1997) to newly fallen litter and is seen irrespective of whether there is a net immobilization or a net release of N from the litter. The slope of this line, namely the increase rate, may vary with litter type. In a review covering about 130 litter decomposition studies, Berg et al. (1997) attempted to systematize this and noted that climate and initial litter N concentrations influence the rate at which N concentration increases in the litter (Figs. 11 and 12). The rate of increase in N concentration was influenced by the climate and at warmer and wetter climates the increase rate was higher when compared with decomposition. This is shown (Fig. 11) using the climate index “actual evapotranspiration” (AET) with a range in AET values corresponding to a climatic transect from mainly the Arctic Circle to the northern part of continental Europe. In natural systems the rate of increase in N concentration in the decomposing litter showed a positive linear relation to the initial N concentration (Berg et al. 1997). In other words, the more N-rich the litter was when it was shed, the faster the litter N concentration increased during decomposition. That N may be tied to the litter’s lignin has been observed by Flaig et al. (1959), among others who investigated this phenomenon for different kinds of lignin. Berg and Theander (1984) and Berg (1988) also observed that the concentration of N in the lignin fraction increased linearly with mass loss as decomposition proceeded. Chemical reactions involving partly degraded lignin and e.g., ammonium (Nömmik and Vahtras 1982; cf. above) appear to depend on pH, and Axelsson and Berg (1988) indicated that the concentration of N limited the reaction rate (determined as irreversible adsorption), suggesting that in more N-rich litter the binding of N to more © 1997 NRC Canada
Berg and Matzner
19
Environ. Rev. Downloaded from www.nrcresearchpress.com by 150.254.164.85 on 04/19/11 For personal use only.
Fig. 12. Linear relationship between initial concentrations of N in decomposing needle and leaf litters and the slope of N concentration versus accumulated mass loss (NCIR) (from Berg et al. 1997). ×, Scots pine needle litter; +, lodgepole pine needle litter; *, white pine neeedle litter; j, Norway spruce; m, deciduous litter.
Fig. 13. A single linear relationship between the climatic index actual evapotranspiration (AET) and the slope of lignin concentration versus accumulated mass loss (LCIR) in decomposing needle litter of Scots pine (j), Norway spruce (×), lodgepole pine, and white pine (+) (from Berg et al. 1997).
recalcitrant forms may take place at a higher rate. Such a rate may also depend on the number of available reactive sites in the litter material. In a climatic transect, Berg et al. (1993) observed that the lignin concentration in decomposing litter increased faster in wetter and warmer climates (with higher AET values; Fig. 13), indicating that the soluble material and the holocelluloses were decomposed at a relatively higher rate under such conditions.
This finding was later generalized by Johansson et al. (1995) and by Berg et al. (1997; Fig. 14). In the favourable climate also the lignin was in part decomposed but less, which may mean leaving more reactive lignin parts in the litter. When combining the relative increase rate for N, which is dependent on climate, with that for lignin, they found a good correlation for both Scots pine needle litter alone (Fig. 15) and for several species combined (Berg et al. 1997). © 1997 NRC Canada
20
Environ. Rev. Vol. 5, 1997 Table 10. Slopes of the regression lines relating N concentrations to accumulated mass loss for decomposing brown and green needle litters of Norway spruce. Rate of change in concentration (mg %-1) Brown needle litter N0 plot Norway spruce
Environ. Rev. Downloaded from www.nrcresearchpress.com by 150.254.164.85 on 04/19/11 For personal use only.
Scots pine
***
0.1393 (0.0113) 0.1033
Green needle litter
N2P2 plot ***
0.2073 (0.024) 0.1453a
N0 plot ***
0.2894 (0.0228) —
N2P2 plot 0.3858*** (0.0487) —
Note: Standard errors are indicated within parentheses. The needle litters originated from control plots and were incubated in control and fertilized plots. Levels of significance are indicated: ***, p < 0.001; *, p < 0.05 (from Berg and Tamm 1994; B. Berg, unpublished). a Scots pine only received N fertilizer.
Fig. 14. Linear relationships between increases in lignin concentration and accumulated litter mass loss (modified from Berg et al. 1993). Different climatic indices are given, indicating that the slope may change with climate.
We can thus speculate that there is a relation between the lignin decomposition pattern and that for preserving N in a forest system. Whether such a relation exists can be determined by examining humus samples from the same forest type grown under different climatic conditions. Using data from the Swedish National Survey of Forest Soils and Vegetation (Anonymous 1996), we compared the concentration of N in humus at different sites along a 1600-km-long transect over Sweden and found a significant negative linear relation between latitude and N concentration in humus. This observation supports our hypothesis that warmer and wetter conditions favour the development of a humus more rich in N. However, one could still argue that the higher N concentrations could be due to the higher N deposition in the southern parts of the country, which may be true. Furthermore, observations by Berg et al. (1995) that N concentrations in newly shed Scots pine needle litter increase with increasing AET and the finding that the concentration of N in decomposing litter increases faster with higher N concentration (Fig. 12) offer additional support.
5.2. Systems with N additions When N is introduced into the litter system, normally as NH4 and NO3, it can be taken up by microorganisms in the litter, but the uptake of N to litter from the surrounding litter material has also been demonstrated. In an attempt to simulate natural N dynamics versus decomposition, Staaf (1980), using leaf litter of common beech, found that additions of protein or very N-rich litter to the soil clearly influenced the N dynamics of the beech leaf litter. It appeared that the N was taken up by the litter and conserved there. We are restricted to discussing N dynamics in forests with N added experimentally since, to our knowledge, no N dynamics data are available for comparable forests with and without N deposition. In an N fertilization experiment Berg and Tamm (1994) compared concentrations of N in decomposing, green and brown Norway spruce needle litter. They found that N concentrations increased about linearly with accumulated mass loss in both litter types. To compare relative rates of concentration increases, they introduced a slope coefficient; high coefficient values reflected high increase rates and vice versa. Slopes of the regression lines relating N concentrations to accumulated mass loss in brown needles were 0.1393 for the control plot and 0.2073 for the plot given N fertilizer (Table 10) and were significantly different (Fig. 16). For the green needles the pattern was similar, with increase rates being 0.2894 and 0.3858 in the control and fertilized plots, respectively, the difference being significant (Fig. 16; Table 10). Thus, in both cases the slopes were steeper in the litter incubated in the fertilized plot. The same was found with Scots pine needle litter incubated in control and fertilized Scots pine forests (Berg et al. 1997). This indicates that fertilization enhanced the uptake rate by decomposing microorganisms, which may have had a more easily available supply of N. The N pattern described above agrees well with that described by Berg et al. (1997) for decomposing litter. In other words, the more N rich the needles were when they were shed, the faster the litter N concentration increased. An important difference is, of course, that this latter observation was made in an experiment with N additions, suggesting that the fate of the added N is similar to that of the natural one. Similar findings were obtained in an earlier study using Scots pine needle litter with a wide range of initial N concentrations (B. Berg, unpublished). We mentioned above that the rate of the chemical fixation © 1997 NRC Canada
21
Berg and Matzner
Environ. Rev. Downloaded from www.nrcresearchpress.com by 150.254.164.85 on 04/19/11 For personal use only.
Fig. 15. Single linear relationship between NCIR and LCIR in decomposing Scots pine needle litter (from Berg et al. 1997).
reaction described by Nömmik and Vahtras (1982) may be limited by a lack of reactive N forms. This would then mean that, in a soil with higher levels of available ammonium or amino acids, more N would be incorporated into the decomposing material in a first step to form, for example, fulvic acids. This is one mechanism that may help explain the rates of increase in N concentrations. By contrast, Berg et al. (1987) found relatively small differences in fungal mycelium in decomposing Scots pine needle litter differing in N status. The former mechanism may thus help explain the observed increase in N tied to the lignin fraction observed (Flaig et al. 1959; Berg and Theander 1984). If N is bound to partly decomposed lignin, the findings concerning a release mechanism, as discussed below, may be valid.
Fig. 16. Concentrations of N in decomposing Norway spruce needle litter in relation to accumulated mass loss (from Berg and Tamm 1994). m, brown needles in control plot; n, green needles in control plot; h, brown needles in fertilized plot; j, green needles in fertilized plot.
5.3. Release of N It has been suggested that the release of N from decomposing litter depends on the C:N ratio in the decomposing material. In his review, Fog (1988) gives a good background to this from older literature and provides strong reasons to question the validity of this relation. Mulder et al. (1969) gave a rule of thumb that above a quotient of 50 mineralization occurs, while below this value immobilization takes place, but this has since been shown to be incorrect. During the last decade, several papers have questioned the ability of the C:N ratio to predict C and N mineralization (e.g., Herman et al. 1977; McClaugherty and Berg 1987; Berg and Ekbohm 1983). The switch from N immobilization to N mineralization does not occur at a specific C:N ratio (Bosatta and Staaf 1982; Berg and McClaugherty 1987) and such a ratio for immobilization/ mineralization may vary with the system (Berg and Ekbohm 1983). In an attempt to determine the mechanisms of N release from decomposing litter, Berg and McClaugherty (1989) found that the onset of lignin decomposition and the start of N and P net release from the litter coincided and actually could be related over a good range of litter types. Some years later this © 1997 NRC Canada
22
was confirmed by Gallardo and Merino (1992) working in a Mediterranean dune system. Although these studies may change our idea of a regulation of N release, they do not reveal in what form the N is released.
Environ. Rev. Downloaded from www.nrcresearchpress.com by 150.254.164.85 on 04/19/11 For personal use only.
6. Conclusions We can conclude that since humus buildup in undisturbed boreal forests does not seem to reach a steady state, N deposition will affect the rate of humus buildup. Deposition-induced increases in concentrations of N in litter lead to changes in concentrations of other nutrients as well. For example, concentrations of P and S in soil organic matter increase, whereas those of Mn and Ca decrease (cf. Falkengren-Grerup 1986). This kind of imbalance in nutrient composition as compared with the original one at a given site will have certain consequences. Thus, the suggested mechanism for humus accumulation (Berg et al. 1996) as based on litter concentrations of mainly N and Mn in the litter will be distributed, causing a much higher buildup rate of humus. The relatively inert humus will store not only part of the deposited N but also part of the system’s nutrients which will be taken out of circulation, possibly causing some nutrients to be limiting. Additions of N may also suppress the growth of mat- forming fungi, which supply the vegetation with nutrients.
7. Acknowledgements We express our appreciation and thanks to Dr. Ryszard Laskowski, Jagiellonian University, Cracow, Poland, and to Dr. Lage Bringmark, Swedish University of Agricultural Sciences, Uppsala, Sweden, for allowing us to use their unpublished data. Financial support for this work was provided by German Ministry for Education, Science, Research and Technology (BMBF, grant No. BEO–51–033947617) to Dr. Björn Berg, while working as a guest scientist at Bayreuther Institut fuer Terrestrische Ökosystemforschung, University of Bayreuth, Bayreuth, Germany.
8. References Aber, J.A., Melillo, J.M., Nadelhofer, K.J., Pastor, J., and Boone, R. 1991. Factors controlling nitrogen cycling and nitrogen saturation in northern temperate forest ecosystems. Ecol. Appl. 1: 303–315. Adams, S.N., and Cornforth, I.S. 1973. Some short-term effects of lime and fertilizers on a Sitka spruce plantation. II. Laboratory studies on litter decomposition and nitrogen mineralization. Forestry, 46: 39–47. Alexander, M. 1977. Introduction to soil microbiology. 2nd ed. Wiley, London. pp. 1–467. Allison, F.E. 1966. The fate of nitrogen applied to soils. Adv. Agron. 18: 219–258. Anonymous. 1996. Swedish national survey of forest soils and vegetation. Department of Forest Soils, Swedish University of Agricultural Sciences, Uppsala, Sweden. Archibald, F., and Roy, B. 1992. Production of manganic chelates by laccase from the lignin-degrading fungus Trametes (Coriolus) versicolor. Appl. Environ. Microbiol. 58: 1496–1499. Arnebrant, K., and Söderström, B. 1992. Effects of different fertilizer treatments on ectomycorrhizal colonization potential in two Scots pine forests in Sweden. For. Ecol. Manage. 53: 77–89.
Environ. Rev. Vol. 5, 1997 Attiwill, P.M., and Maheswaran, J. 1989. Soil respiration in Eucalypt forests of southeastern Australia. Biol. Fertil. Soils, 8(2): 154–159. Axelsson, G., and Berg, B. 1988. Fixation of ammonia (15N) to Scots pine needle litter in different stages of decomposition. Scand. J. For. Res. 3: 273–280. Bååth, E., Lundgren, B., and Söderström, B. 1981. Effects of nitrogen fertilization on the activity and biomass of fungi and bacteria in a podzolic soil. Zentralbl. Bakteriol. Mikrobiol. Hyg. Abt. 1 Orig. C, 2: 90–98. Bal, L. 1973. Micromorphological analysis of soils. Soil Survey Papers of the Netherlands Soil Survey Institute No. 6, Wageningen, the Netherlands. Barder, M.J., and Crawford, D.L. 1981. Effects of carbon and nitrogen supplementation on lignin and cellulose decomposition by a Streptomyces. Can. J. Microbiol. 27: 859–863. Beckjord, P.R., Melhuish, J.M., and McIntosh, M. 1985. Effects of nitrogen and phosphorus fertilization on growth and formation of Quercus alba and Q. rubra seedlings by Pisolitus tinctorius and Scleroderma auranteum. Can. J. Bot. 63: 1677–1680. Berg, B. 1986. Nutrient release from litter and humus in coniferous forest soils—a minireview. Scand. J. For. Res. 1: 359–370. Berg, B. 1988. Dynamics of nitrogen (15N) in decomposing Scots pine (Pinus silvestris L.) needle litter. Long-term decomposition in a Scots pine forest. VI. Can. J. Bot. 66: 1539–1546. Berg, B., and Cortina, J. 1995. Nutrient dynamics in some leaf and needle litter types of different chemical composition in a Scots pine forest. Scand. J. For. Res. 10: 1–11. Berg, B., and Ekbohm, G. 1983. Nitrogen immobilization to decomposing needle litter at variable carbon–nitrogen ratios. Ecology, 64: 63–67. Berg, B., and Ekbohm, G. 1991. Litter mass-loss rates and decomposition patterns in some needle and leaf litter types. Long-term decomposition in a Scots pine forest. VII. Can. J. Bot. 69: 1449–1456. Berg, B., and Ekbohm, G. 1993. Decomposing needle litter in Lodgepole pine (Pinus contorta) and Scots pine (Pinus sylvestris) monocultural systems. Is there a maximum mass loss? Scand. J. For. Res. 8: 457–465. Berg, B., and Lundmark, J.E. 1987. Decomposition of needle litter in lodgepole pine and Scots pine monocultures—a comparison. Scand. J. For. Res. 2: 3–12. Berg, B., and McClaugherty, C. 1987. Nitrogen release in forest litter in relation to lignin decomposition. Biogeochemistry, 4: 219–225. Berg, B., and McClaugherty, C. 1989. Nitrogen and phosphorus release from decomposing litter in relation to the disappearance of lignin. Can. J. Bot. 67: 1148–1156. Berg, B., and Staaf, H. 1980. Decomposition rate and chemical changes in decomposing needle litter of Scots pine. II. Influence of chemical composition. Ecol. Bull. 32: 373–390. Berg, B., and Staaf, H. 1981. Leaching, accumulation and release of nitrogen in decomposing forest litter. Ecol. Bull. 33:163–178. Berg, B., and Tamm, C.O. 1991a. Decomposition and nutrient dynamics of litter in long-term optimum nutrition experiments. I. Organic matter decomposition in Norway spruce (Picea abies) needle litter. Scand. J. For. Res. 6: 305–321. Berg, B., and Tamm, C.O. 1991b. Decomposition and nutrient dynamics of Norway spruce needle litter in a long-term optimum nutrition experiment. Department of Ecology and Environmental Research, Swedish University of Agricultural Sciences, Uppsala, Sweden. Rep. No 39. Berg, B., and Tamm, C.O. 1994. Decomposition and nutrient dynamics of litter in long-term optimum nutrition experiments. II. Nutrient concentration changes in decomposing Norway spruce (Picea abies) needle litter. Scand. J. For. Res. 9: 99–105. Berg, B., and Theander, O. 1984. The dynamics of some nitrogen fractions in decomposing Scots pine needles. Pedobiologia, 27: 161–167. © 1997 NRC Canada
Environ. Rev. Downloaded from www.nrcresearchpress.com by 150.254.164.85 on 04/19/11 For personal use only.
Berg and Matzner Berg, B., and Wessen, B. 1984. Changes in organic-chemical components and ingrowth of fungal mycelium in decomposing birch leaf litter as compared to pine needles. Pedobiologia, 26: 285–298. Berg, B., Hannus, K., Popoff, T., and Theander, O. 1982. Changes in organic-chemical components of needle litter during decomposition. Long-term decomposition in a Scots pine forest. I. Can. J. Bot. 60: 1310–1319. Berg, B., Ekbohm, G., and McClaugherty, C.A. 1984. Lignin and holocellulose relations during long-term decomposition of some forest litters. Long-term decomposition in a Scots pine forest. IV. Can. J. Bot. 62: 2540–2550. Berg, B., Staaf, H., and Wessen, B. 1987. Decomposition of Scots pine needle litter of differing nutrients concentrations. Scand. J. For. Res. 2: 399–415. Berg, B., Tamm, C.O., and Aronsson, A. 1991. The influence of stand density and litter quality on litter decomposition rates in manipulated Scots pine forests. The effect of fertilization and irrigation. Department of Ecology and Environmental Research, Swedish University of Agricultural Sciences, Uppsala, Sweden. Rep. No. 43. Berg, B., McClaugherty, C., and Johansson, M. 1993. Litter massloss rates in late stages of decomposition at some climatically and nutritionally different pine sites. Long-term decomposition in a Scots pine forest. VIII. Can. J. Bot. 71: 680–692. Berg, B., McClaugherty, C., Virzo De Santo, A., Johansson, M.-B., and Ekbohm, G. 1995. Decomposition of forest litter and soil organic matter—a mechanism for soil organic matter buildup? Scand. J. For. Res. 10: 108–119. Berg, B., Ekbohm, G., Johansson, M.-B., McClaugherty, C., Rutigliano, F., and Virzo De Santo, A. 1996. Some foliar litter types have a maximum limit for decomposition—a synthesis of data from forest systems. Can. J. Bot. 74: 659–672. Berg, B., McClaugherty, C., and Johansson, M.-B. 1997. Chemical changes in decomposing litter can be systemized with respect to the litter’s initial chemical composition. Reports from the Departments in Forest Ecology and Forest Soils, Swedish University of Agricultural Sciences, Uppsala, Sweden. Rep. 74:1–85. Bergkvist, B., and Folkeson, L. 1992. Soil acidification and element fluxes of a Fagus sylvatica forest influenced by simulated nitrogen deposition. Water Air Soil Pollut. 65: 111–133. Billet, M.F., Fitzpatrick, E.A., and Cresser, M.S. 1990. Changes in the storage of carbon and nitrogen status of forest soil organic horizons between 1949/50 and 1987. Environ. Pollut. 66: 67–79. Blagodatskiy, S.A., Larionova, A.A., and Tevdokimov, I.Y. 1993. Effect of mineral nitrogen on the respiration rate and growth efficiency of soil microorganisms. Eurasian Soil Sci. 25: 85–95. Bobbink, R., Boxman, D., Fremstad, E., Heil, G., Houdijk, A., and Roelofs, J. 1992. Critical loads for nitrogen eutrophication of terrestrial and wetland ecosystems based upon changes in vegetation and fauna (alpine heathlands, deposition). In Critical loads for nitrogen—a workshop report. Edited by P.E. Grennfelt and E. Thörnelöf. Nordic Council of Ministers, Copenhagen. Nord Rep. 1992:41. Bockheim, J.G., Leide, J.E., and Freilich, L.E. 1989. Red pine growth and chemical composition of foliage and forest floors across a precipitation gradient in Wisconsin. Can. J. For. Res. 19: 1543–1549. Bollag, J.-M., Minard, R.D., and Liu, S.-Y. 1983. Cross-linkage between anilines and phenolic constituents. Environ. Sci. Technol. 17: 72–80. Bosatta, E., and Staaf, H. 1982. The control of nitrogen turn-over in forest litter. Oikos, 39: 143–151. Brandrud, T.E. 1995. The effects of experimental nitrogen addition on the ectomycorrhizal fungus flora in an oligotrophic spruce forest at Gårdsjön, Sweden. For. Ecol. Manage. 71: 111–122. Bringmark, E., and Bringmark, L. 1991. Large-scale pattern of mor layer degradation in Sweden measured as standardized respira-
23 tion. In Humic substances in the aquatic and terrestrial environment. Proceedings of an International Symposium, Linköping, Sweden, 21–23 August 1989. Lecture Notes in Earth Sciences No. 33. Springer-Verlag, Berlin. Dirkse, G.M., and Van Dobben, H.F. 1989. Het effect van bemesting op de samenstelling van de kruidlaag van dennenbossen. Natura, 9: 208–212. [In Dutch.] Dirkse, G.M., Van Dobben, H.F., and Tamm, C.O. 1991. Effects of fertilization on herb and moss layers of a Scots pine stand in Lisselbo (Sweden); a multivariate analysis. Research Institute for Nature Management, Leersum, the Netherlands. Rep. 91/7. pp. 1–40. Dugger, W.M. 1983. Boron in plant metabolism. In Inorganic plant nutrition. Edited by A. Läuchli and R.L. Bielski. SpringerVerlag, Berlin. pp. 626–650. Edmonds, R. 1980. Litter decomposition and nutrient release in Douglas fir, Red alder, western hemlock, and Pacific silver fir ecosystems in western Washington. Can. J. .For. Res. 10: 327–337. Ekbohm, G., and Rydin, B. 1990. On estimating the species–area relationship. Oikos, 57: 145–146. Eriksson, K.-E., Blanchette, R.A., and Ander, P. 1990. Microbial and enzymatic degradation of wood and wood components. Springer Series in Wood Science. Springer Verlag, Berlin. Falkengren-Grerup, U. 1986. Soil acidification and vegetation changes in deciduous forest in southern Sweden. Oecologia, 70: 339–347. Falkengren-Grerup, U., and Eriksson, H. 1990. Changes in soil, vegetation and forest yield between 1947 and 1988 in beech and oak sites southern Sweden. For. Ecol. Manage. 38: 37–53. Fessenden, R. J., Calvert, R. F., and Armson, K.A. 1971. Effect of some fertilizers and simazine on the activity of the microorganisms in jack pine humus. For. Chron. 47: 227–228. Findlay, W.P.K. 1934. Studies in the physiology of the wood-destroying fungi. I. The effect of nitrogen content upon the rate of decay of timber. Ann. Bot. 48: 109–117. Flaig, W., Schobinger, U., and Deuel, H. 1959. Umwandlung von Lignin in Huminsäuren bei der Verrottung von Weizenstroh. Chem. Ber. 92(9): 1973–1982. [In German, English summary.] Fog, K. 1988. The effect of added nitrogen on the rate of decomposition of organic matter. Biol. Rev. 63: 433–462. Foster, N. W., Beauchamp, E.G., and Corke, C.T. 1980. Microbial activity in a Pinus banksiana Lamb. forest floor amended with nitrogen and carbon. Can. J. Soil Sci. 60: 199–209. Gallardo, A., and Merino, J. 1992. Nitrogen immobilization in leaf litter at two Mediterranean ecosystems of SW Spain. Biogeochemistry, 15: 213–228. Gallardo, A., and Schlesinger, W.H. 1994. Factors limiting microbial biomass in the mineral soil and forest floor of a warm-temperate forest. Soil Biol. Biochem. 26: 1409–1415. Granhall, U., and Slapokas, T. 1984. Leaf litter decomposition in energy forestry. First-year nutrient release and weight loss in relation to the chemical composition of different litter types. In Ecology and management of forest biomass production systems. Edited by K. Perttu. Department of Ecology and Environmental Research, Swedish University of Agricultural Sciences, Uppsala, Sweden. Rep. No. 15. pp. 131–153. Green, C.J., Blackmer, A.M., and Horton, R. 1995. Nitrogen effects on conservation of carbon during corn residue decomposition in soil. Soil Sci. Soc. Am. J. 59: 453–459. Griffiths, R., Caldwell, B.A., Cromack, K., Jr., and Morita, R.Y. 1990. Douglas-fir forest soils colonized by ectomycorrhizal mats. 1. Seasonal variation in nitrogen chemistry and nitrogen transformation rates. Can. J. For. Res. 20: 211–218. Harmsen, G.W., and van Schreven, D.A. 1955. Mineralization of organic nitrogen in soil. Adv. Agron. 7: 299–398. Herman, W.A., McGill, W.B., and Dormaar, J.F. 1977. Effects of initial chemical composition on decomposition of roots of three grass species. Can. J. Soil Sci. 57: 205–215. © 1997 NRC Canada
Environ. Rev. Downloaded from www.nrcresearchpress.com by 150.254.164.85 on 04/19/11 For personal use only.
24 Hintikka, V., and Näykki, O. 1967. Notes on the effects of the fungus Hydnellum ferrugineum on forest soil and vegetation. Commun. Inst. For. Fenniae, 62: 1–22. Hohmann, J., and Neely, R.K. 1993. Decomposition of Sparangium eurycarpum under controlled pH and nitrogen regimes. Aquat. Bot. 46: 17–33. Howard, P.J.A., and Howard, D.M. 1974. Microbial decomposition of tree and shrub leaf litter. 1. Weight loss and chemical composition of decomposing litter, Oikos, 25: 311–352. Hungate, R.E. 1940. Nitrogen content of sound and decayed coniferous woods and its relation to loss in weight during decay. Bot. Gaz. 102: 382–392. Jacquin, F., and Mangenot, F. 1959. Populations microbiennes des bois. III. Humification in vitro d’une sciure de hetre. Plant Soil, 9: 377–391. Jenny, H. 1980. The soil resource. In Origin and behaviour. Springer Verlag, New York. pp. 1–248. Johansson, M.-B. 1994. The influence of soil scarification on the turnover rate of slash needles and nutrient release. Scand. J. For. Res. 9: 170–179. Johansson, M.-B., Berg, B., and Meentemeyer, V. 1995. Litter massloss rates in late stages of decomposition in a climatic transect of pine forests. Long-term decomposition in a Scots pine forest. IX. Can. J. Bot. 73: 1509–1521. Keyser, P., Kirk, T.K., and Zeikus, I.G. 1978. Ligninolytic enzyme of Phanerochaete chrysosporium: synthesized in the absence of lignin in response to nitrogen starvation. J. Bacteriol. 135: 790–797. Kondo, R., Iimori, T., Imamura, H., and Nishida, T. 1990. Polymerization of DHP and depolymerization of DHP-glucoside by lignin oxidizing enzymes. J. Biotechnol. 13: 181–188. Kuyper, T.W. 1989. Auswirkungen der Waldduengung auf die Mykoflora. Mitteilung 398 der Biologischen Station Wijster, Wijster, the Netherlands. pp. 5–20. [In German, English summary.] Kuyper, T.W., and de Vries, B.W. 1990. Effects of fertilization on the mycoflora of a pine forest. Wageningen Agric. Univ. Pap. 90–6: 102–112. Lewis, D.H. 1980. Boron, lignification and the origin of vascular plants—a unified hypothesis. New Phytol. 84: 209–229. Lindeberg, G. 1944. Ueber die Physiologie Ligninabbauender Bodenhymenomyzeten. Symb. Bot. Ups. 8(2): 1–183. Liu, S.-Y., Freyer, A.J., Minard, R.D., and Bollag, J.-M. 1985. Enzyme-catalyzed complex-formation of amino esters and phenolic humus constituents. Soil Sci. Soc. Am. J. 49: 337–342. Lobarzewski, J., Trojanowski, K., and Wojtas-Wasilewska, M. 1982. The effects of fungal peroxidases on Na-lignosulfonates. Holzforschung, 36: 173–176. Lousier, J.D., and Parkinson, D. 1976. Litter decomposition in a cool deciduous forest. Can. J. Bot. 54: 419–436. Maas, E.F., and Adamson, R.M. 1972. Resistance of sawdust, peats, and bark to decomposition in the presence of soil and nutrient solution. Soil Sci. Soc. Am. Proc. 36: 769–772. Makarov, M.I., and Krasilnikova, T.L. 1987. Nitrogen and phosphorus content in plants under conditions of industrial pollution of the atmosphere and the soil. Moscow Univ. Soil Sci. Bull. 42: 2–11. Manderscheid, B., and Matzner, E. 1995. Spatial heterogeneity of soil solution chemistry in a mature Norway spruce (Picea abies (L.) Karst) stand. Water Air Soil Pollut. 85: 1185–1190. Mangenot, F., and Reymond, J. 1963. Populations microbiennes des bois. V. Influence de quelques sources de carbone et d’azote sur la décomposition d’une sciure. Rev. Gen. Bot. 70: 107–129. [In French.] Matzner, E. 1989. Acidic precipitation: case study solling. In Advances in environmental sciences: acidic precipitation. Vol. 1. Edited by D.C. Adriano and M. Havas. Springer Verlag, Berlin. McClaugherty, C., and Berg, B. 1987. Cellulose, lignin and nitrogen levels as rate regulating factors in forest litter decomposition. Pedobiologia, 30: 101–112.
Environ. Rev. Vol. 5, 1997 Melillo, J.M., Aber, J.D., and Muratore, J. 1982. Nitrogen and lignin control of hardwood leaf litter decomposition dynamics. Ecology, 63: 621–626. Miller, H. 1979. The nutrient budgets of even-aged forests. In The ecology of even-aged forest plantations. Proceedings of the Meeting of Division I, International Union of Forestry Research Organisations, September 1978, Edinburgh. Edited by E.D. Ford, D.C. Malcolm, and J. Atterson. Institute of Terrestrial Ecology, Cambridge. pp. 221–238. Miller, H.G., and Miller, J.D. 1976. Analysis of needle fall as a means of assessing nitrogen status in pine. Forestry, 49: 57–61. Mulder, E.G., Lie, T.A., and Woldendorp, J.W. 1969. Biology and soil fertility. In Soil biology, reviews of research. UNESCO, Paris. pp. 163–208. Nohrstedt, H.-Ö., Arnebrant, K., Bååth, E., and Söderström, B. 1989. Changes in carbon content, respiration rate, ATP content and microbial biomass in nitrogen-fertilized pine forests soils in Sweden. Can. J. For. Res. 19: 323–328. Nömmik, H., and Möller, G. 1981. Nitrogen recovery in soil and needle biomass after fertilization of a Scots pine stand, and growth responses obtained. Stud. For. Suec. 159: 1–37. Nömmik, H., and Vahtras, K. 1982. Retention and fixation of ammonium and ammonia in soils. Agron. Monogr. 22: 123–171. Ohtonen, R., and Markkola, A.M. 1991. Biological activity and amount of FDA mycelium in mor humus of Scots pine stands (Pinus sylvestris L.) in relations to soil properties and degree of pollution. Biogeochemistry, 13: 1–26. Paul, E. 1984. Dynamics of organic matter in soils. Plant Soil, 76: 75–285. Perez, J., and Jeffries, T.W. 1992. Roles of manganese and organic acid chelators in regulating lignin degradation and biosynthesis of peroxidases by Phanerochate chrysosporium. Appl. Environ. Microbiol. 58: 2402–2409. Persson, T., and Wiren, A. 1989. Microbial activity in forest soils in relation to acid/base and carbon/nitrogen status. Meddelelser fra Norsk institutt for skogforskning, 42: 83–95. Pregitzer, K.S., and Burton, A. 1992. Foliar sulfur and nitrogen along an 800-km pollution gradient. Can. J. For. Res. 22: 1761–1769. Reid, I.D. 1983. Effects of nitrogen sources on cellulose and synthetic lignin degradation by Phanerochaete chrysosporium. Appl. Environ. Microbiol. 45: 838–842. Roberge, M.R. 1976. Respiration rates for determining the effects of urea on the soil-surface organic horizon of a black spruce stand. Can. J. Microbiol. 22: 1328–1335. Roberge, M.R., and Knowles, R. 1966. Ureolysis, immobilization and nitrification in black spruce humus. Soil Sci. Soc. Am. Proc. 30: 201–204. Rosen, K., Gundersen, P., Tegnhammar, L., Johansson, M., and Frogner, T. 1992. Nitrogen enrichment of Nordic forest ecosystems—the concept of critical loads. Ambio, 21: 364–368. Ruehling, C., and Tyler, G. 1991. Effects of simulated nitrogen deposition to the forest floor on the macrofungal flora of a beech forest. Ambio, 20: 261–263. Saito, T. 1966. Sequential pattern of decomposition of beech litter with special reference to microbial succession. Ecol. Rev. 16: 245–254. Salonius, P. O. 1972. Microbiological response to fertilizer treatments in organic forest soils. Soil Sci. 114: 12–19. Smolander, A., Kurka, A., Kitunen, V., and Mälkönen, E. 1994. Microbial biomass C and N, and respiratory activity in soil of repeatedly limed and N- and P-fertilized Norway spruce stands. Soil Biol. Biochem. 26(8): 957–962. Söderström, B., Bååth, E., and Lundgren, B. 1983. Decrease in soil microbial activity and biomasses owing to nitrogen amendments. Can. J. Microbiol. 29: 1500–1506. Staaf, H. 1980. Influence of chemical composition, addition of raspberry leaves and nitrogen supply on decomposition rate and © 1997 NRC Canada
Environ. Rev. Downloaded from www.nrcresearchpress.com by 150.254.164.85 on 04/19/11 For personal use only.
Berg and Matzner dynamics of nitrogen and phosphorus in beech leaf litter. Oikos, 35: 55–62. Stevenson, F.J. 1982. Humus chemistry. Genesis, composition, reactions. John Wiley and Sons, New York. Tamm, C.O. 1991. Nitrogen in terrestrial ecosystems. Questions of productivity, vegetational changes, and ecosystem stability. Ecological Studies 81. Springer Verlag, Berlin. Tamm, C.O., Nilsson, Å., and Wiklander, G. 1974. The optimum nutrition experiment Lisselbo. A brief description of an experiment in a young stand of Scots pine (Pinus silvestris L). Department of Forest Ecology and Forest Soils, Royal College of Forestry, Stockholm. Res. Notes No. 18. Tamm, C.O., Aronsson, A., and Burgtorf, H. 1984. A brief description in a young stand of Norway spruce. Inst f Skogsekologi och Marklära, Swedish University of Agricultural Sciences, Uppsala, Sweden. Rep. No. 17. [In Swedish, English summary.] Tamm, C.O., Aronsson, A., and Popovic, B. 1998. Nutrient optimization and nitrogen saturation experiments in pine forests (Pinus sylvestris). Stud. For. Suec. In press. Taylor, B.R., Parkinson, D., and Parsons, W. 1989. Nitrogen and lignin content as predictors of litter decay rates: a microcosm test. Ecology, 70: 97–104.
25 Tremorshuizen, A.J. 1993. The influence of nitrogen fertilisers on ectomycorrhizas and their fungal scarpospores in young stands of Pinus sylvestris. For. Ecol. Manage. 57: 179–189. Tyler, G. 1987. Probable effects of soil acidification and nitrogen deposition on the floristic composition of oak (Quercus robur L.) forest. Flora, 179: 165–170. Tyler, G., Balsberg-Pahlsson, A.-M., Bergkvist, B., FalkengrenGrerup, U., Folkeson, L., Nihlgård, B., Ruehling, A., and Stjernquist, I. 1992. Chemical and biological effects of simulated nitrogen deposition to the ground in a Swedish beech forest. Scand. J. For. Res. 7: 515–532. Unestam, T. 1991. Water repellency, mat formation, and leafstimulated growth of some ectomycorrhizal fungi. Mycorrhiza, 1: 13–20. Waksman, S.A. 1924. Influence of microorganisms upon the carbonnitrogen ratio in soil. J. Agric. Sci. 14: 555–562. Wicklow, D.T., Detroy, R.W., and Adams, S. 1980. Differential modification of the lignin and cellulose components in wheat straw by fungal colonists of ruminant dung-ecological implications. Mycologia, 72: 1065–1076.
© 1997 NRC Canada
Environ. Rev. Downloaded from www.nrcresearchpress.com by 150.254.164.85 on 04/19/11 For personal use only.
This article has been cited by: 1. BjörnBergB. Berga*(email:
[email protected])Maj-BrittJohanssonM.-B. JohanssonbÅkeNilssonÅ. NilssoncPerGundersenP. GundersendLennartNorellL. Norelle. 2009. Sequestration of carbon in the humus layer of Swedish forests — direct measurementsSequestration of carbon in the humus layer of Swedish forests — direct measurements. Canadian Journal of Forest Research 39:5, 962-975. [Abstract] [Full Text] [PDF] [PDF Plus] 2. Matthew P.DaveyM.P. Daveya§+44(0)114 222 4649(email:
[email protected])BjörnBergB. Bergb||(email:
[email protected])*Bridget A.EmmettB.A. Emmettc(email:
[email protected])†PhilRowlandP. Rowlandd(email:
[email protected])‡. 2007. Decomposition of oak leaf litter is related to initial litter Mn concentrationsDecomposition of oak leaf litter is related to initial litter Mn concentrations. Canadian Journal of Botany 85:1, 16-24. [Abstract] [Full Text] 3. Shannon M Berch, Robert P Brockley, Jeff P Battigelli, Shannon Hagerman, and Brian Holl. 2006. Impacts of repeated fertilization on components of the soil biota under a young lodgepole pine stand in the interior of British ColumbiaImpacts of repeated fertilization on components of the soil biota under a young lodgepole pine stand in the interior of British Columbia. Canadian Journal of Forest Research 36:6, 1415-1426. [Abstract] [PDF] [PDF Plus] 4. Per Gundersen, Inger K Schmidt, and Karsten Raulund-Rasmussen. 2006. Leaching of nitrate from temperate forests � effects of air pollution and forest managementLeaching of nitrate from temperate forests � effects of air pollution and forest management. Environmental Reviews 14:1, 1-57. [Abstract] [PDF] [PDF Plus] 5. T I Little, D J Pluth, I G.W Corns, and D W Gilmore. 2002. Post-fire forest floor development along toposequences of white spruce - trembling aspen mixedwood communities in west-central AlbertaPost-fire forest floor development along toposequences of white spruce - trembling aspen mixedwood communities in west-central Alberta. Canadian Journal of Forest Research 32:5, 892-902. [Abstract] [PDF] [PDF Plus] 6. Peter S Homann, Bruce A Caldwell, H N Chappell, Phillip Sollins, and Chris W Swanston. 2001. Douglas-fir soil C and N properties a decade after termination of urea fertilizationDouglas-fir soil C and N properties a decade after termination of urea fertilization. Canadian Journal of Forest Research 31:12, 2225-2236. [Abstract] [PDF] [PDF Plus] 7. Björn Berg, Charles McClaugherty, Amalia Virzo De Santo, and Dale Johnson. 2001. Humus buildup in boreal forests: effects of litter fall and its N concentrationHumus buildup in boreal forests: effects of litter fall and its N concentration. Canadian Journal of Forest Research 31:6, 988-998. [Abstract] [PDF] [PDF Plus] 8. Björn Berg, Maj-Britt Johansson, and Vernon Meentemeyer. 2000. Litter decomposition in a transect of Norway spruce forests: substrate quality and climate controlLitter decomposition in a transect of Norway spruce forests: substrate quality and climate control. Canadian Journal of Forest Research 30:7, 1136-1147. [Abstract] [PDF] [PDF Plus] 9. J W Erisman and W de Vries. 2000. Nitrogen deposition and effects on European forestsNitrogen deposition and effects on European forests. Environmental Reviews 8:2, 65-93. [Abstract] [PDF] [PDF Plus] 10. Björn Berg. 2000. Initial rates and limit values for decomposition of Scots pine and Norway spruce needle litter: a synthesis for N-fertilized forest standsInitial rates and limit values for decomposition of Scots pine and Norway spruce needle litter: a synthesis for N-fertilized forest stands. Canadian Journal of Forest Research 30:1, 122-135. [Abstract] [PDF] [PDF Plus] 11. M Francesca Cotrufo, Björn Berg, and Werner Kratz. 1998. Increased atmospheric CO2 and litter qualityIncreased atmospheric CO2 and litter quality. Environmental Reviews 6:1, 1-12. [Abstract] [PDF] [PDF Plus]